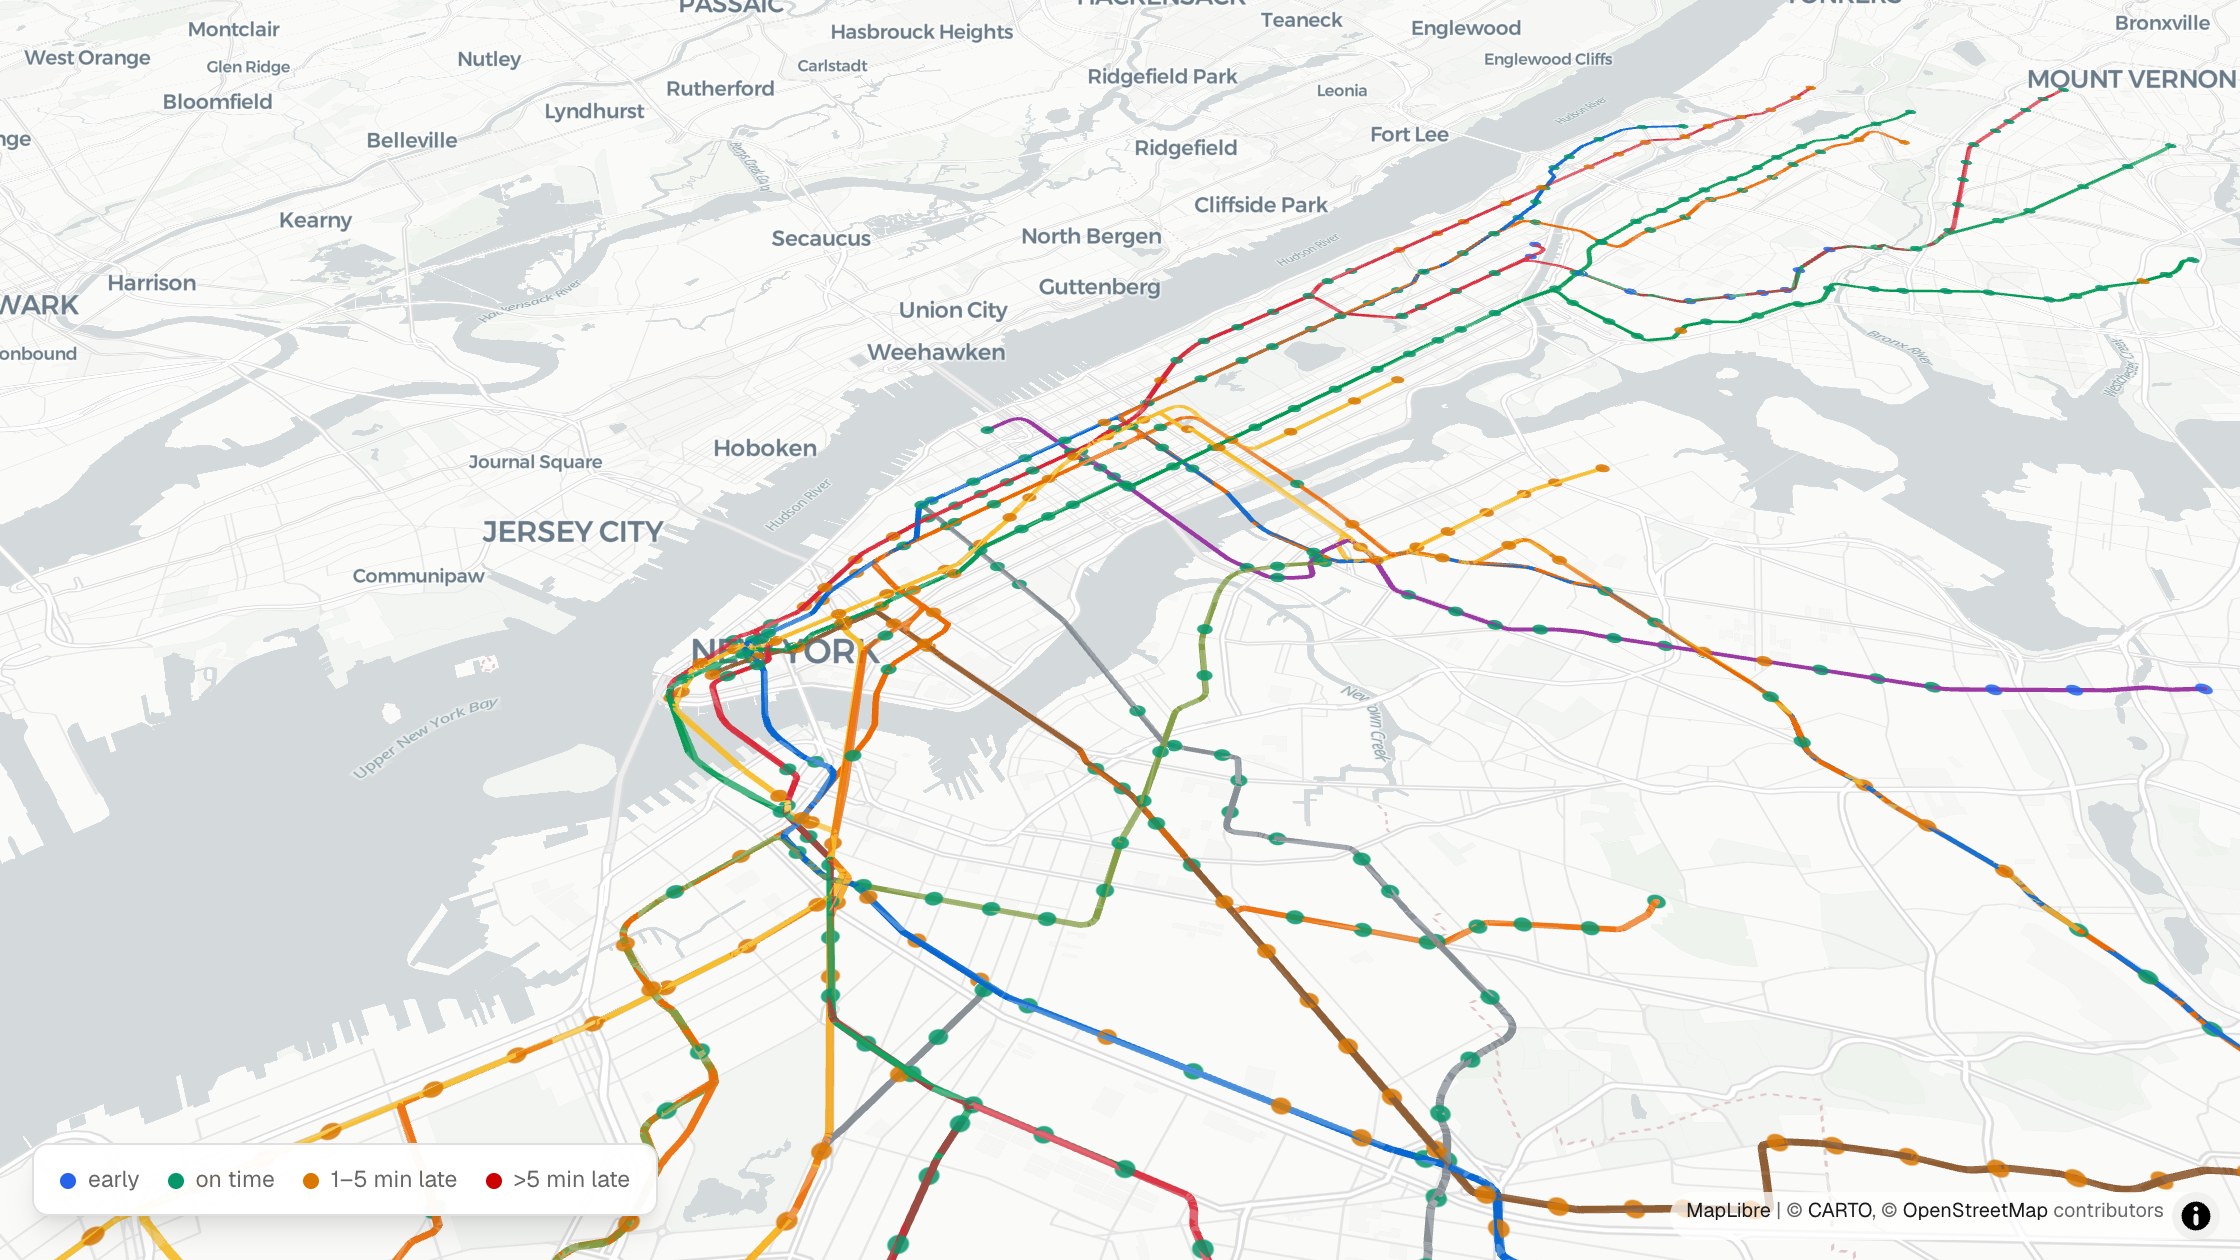
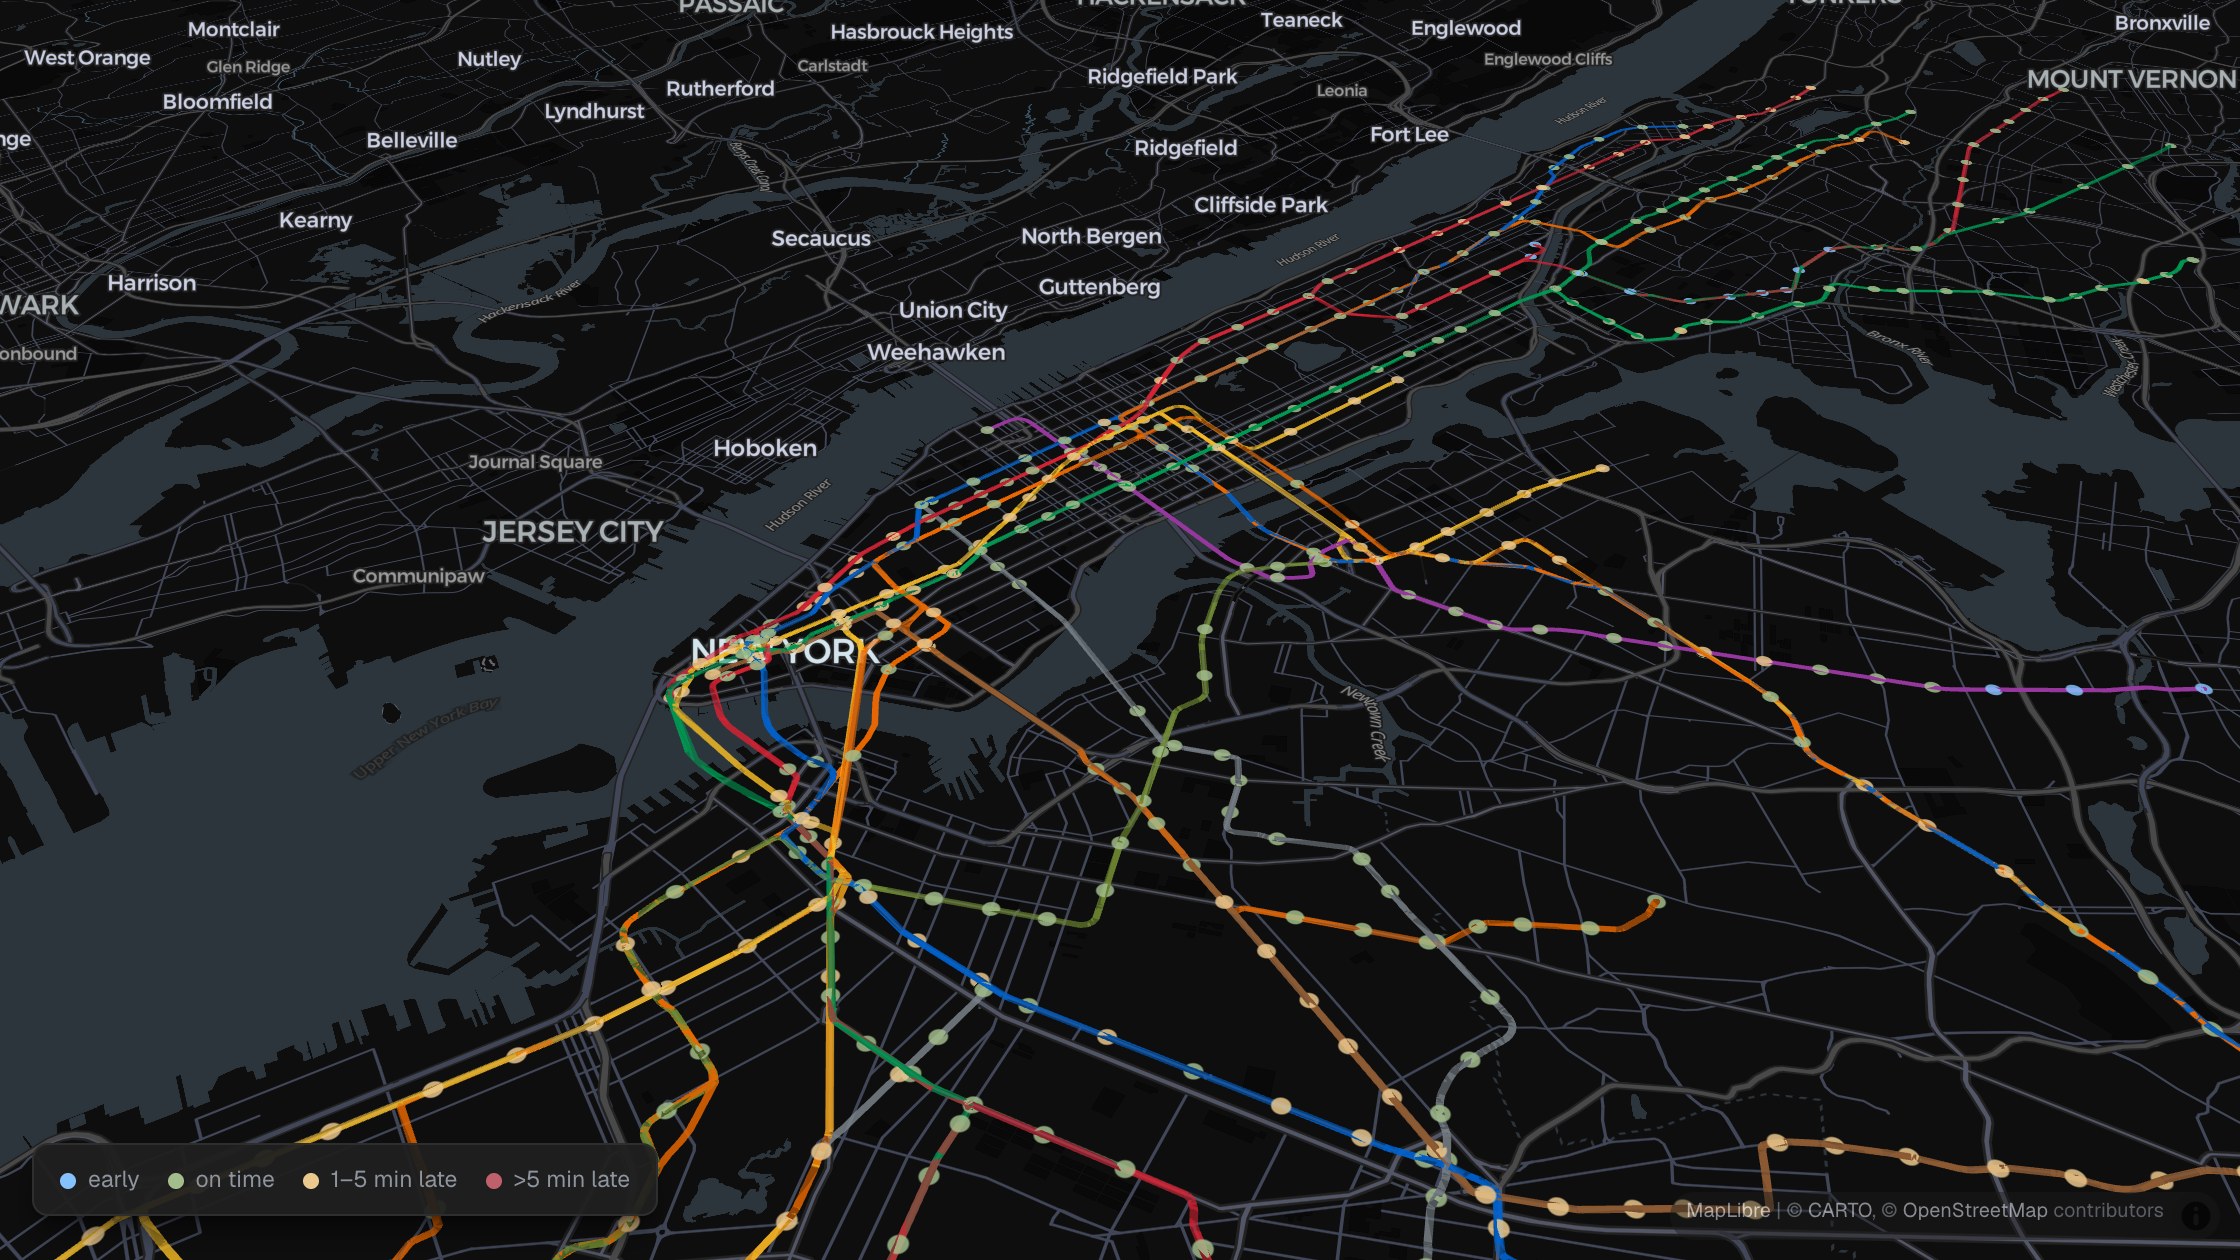
Overview
Transit Pulse asks which cities run the most reliable public transit and answers it in each city's own terms: every trip is scored against the timetable that agency published for that day. Eight cities across five countries were polled around the clock — New York (MTA), Boston (MBTA), Washington DC (WMATA), SF Bay (511.org, roughly 30 operators), Toronto (TTC), Helsinki (HSL), Zurich (opentransportdata.swiss), and Tokyo (ODPT/Toei) — producing 83,938,889 scored stop events across 3,286,158 observed trips over 35 service days. The standings come out Tokyo 98.8, Zurich 93.6, Helsinki 92.2, New York 85.8, Boston 81.1, Washington DC 80.1, Toronto 72.7, SF Bay 60.5.
The 0–100 score is four weighted parts: excess wait at 35%, on-time share at 30% against a −1 to +5 minute window, cancellations at 20%, and bunching at 15%. A city enters the standings only once it banks 20 closed, judged service days, which is why every city's pollers ran continuously for a month before its number was publishable. Where a feed carries nothing to measure — Tokyo publishes no bunching or cancellation signal, several cities publish no vehicle positions — the metric is NULL rather than a zero that would read as perfect.
The pipeline is eight config-driven pollers into Kafka, drained every two hours by Spark on EMR Serverless into Iceberg on S3, read in place by Snowflake as external tables, and modeled by 50 dbt models under Dagster. 2.19 billion raw prediction rows in silver reduce to the 8-row scorecard the public site renders. The month it ran cost $143.71 in AWS usage, covered by credits, on two small ARM instances and a warehouse that suspends after 60 seconds idle.
The Problem
The feeds these agencies publish do not contain arrivals. They contain predictions, restated continuously as a vehicle approaches — Washington DC and Boston restate a given stop 49 times on average. An arrival is the last prediction before the vehicle passes, so the one fact the entire system depends on has to be selected out of billions of superseded rows: 2.19 billion prediction rows in silver reduce to a single finalized row per trip and stop.
Each city then breaks trip identity in its own way. New York encodes origin time into the realtime trip id and drifts it intraday, requiring a custom matcher. Helsinki sends an empty trip_id on every row, so identity is rebuilt from route, direction, date, and start time. Toronto's realtime and static stops live in separate namespaces. Zurich's city feed is the entire Swiss network, 5,122 routes cut to a 615-route allow-list on both the realtime and schedule sides. Tokyo publishes no GTFS-RT for trains at all: ODPT JSON carries an operator-stated delay and no arrival time, so arrivals are detected from station-to-station transitions across snapshots.
Two constraints bound the whole effort. Timetables rotate mid-window, and a new static calendar can erase the days recorded before it. And GTFS-RT has no backfill — the history exists only if you were polling when it happened, so each city had to accrue its 20 judged days in real time before it could be ranked at all.
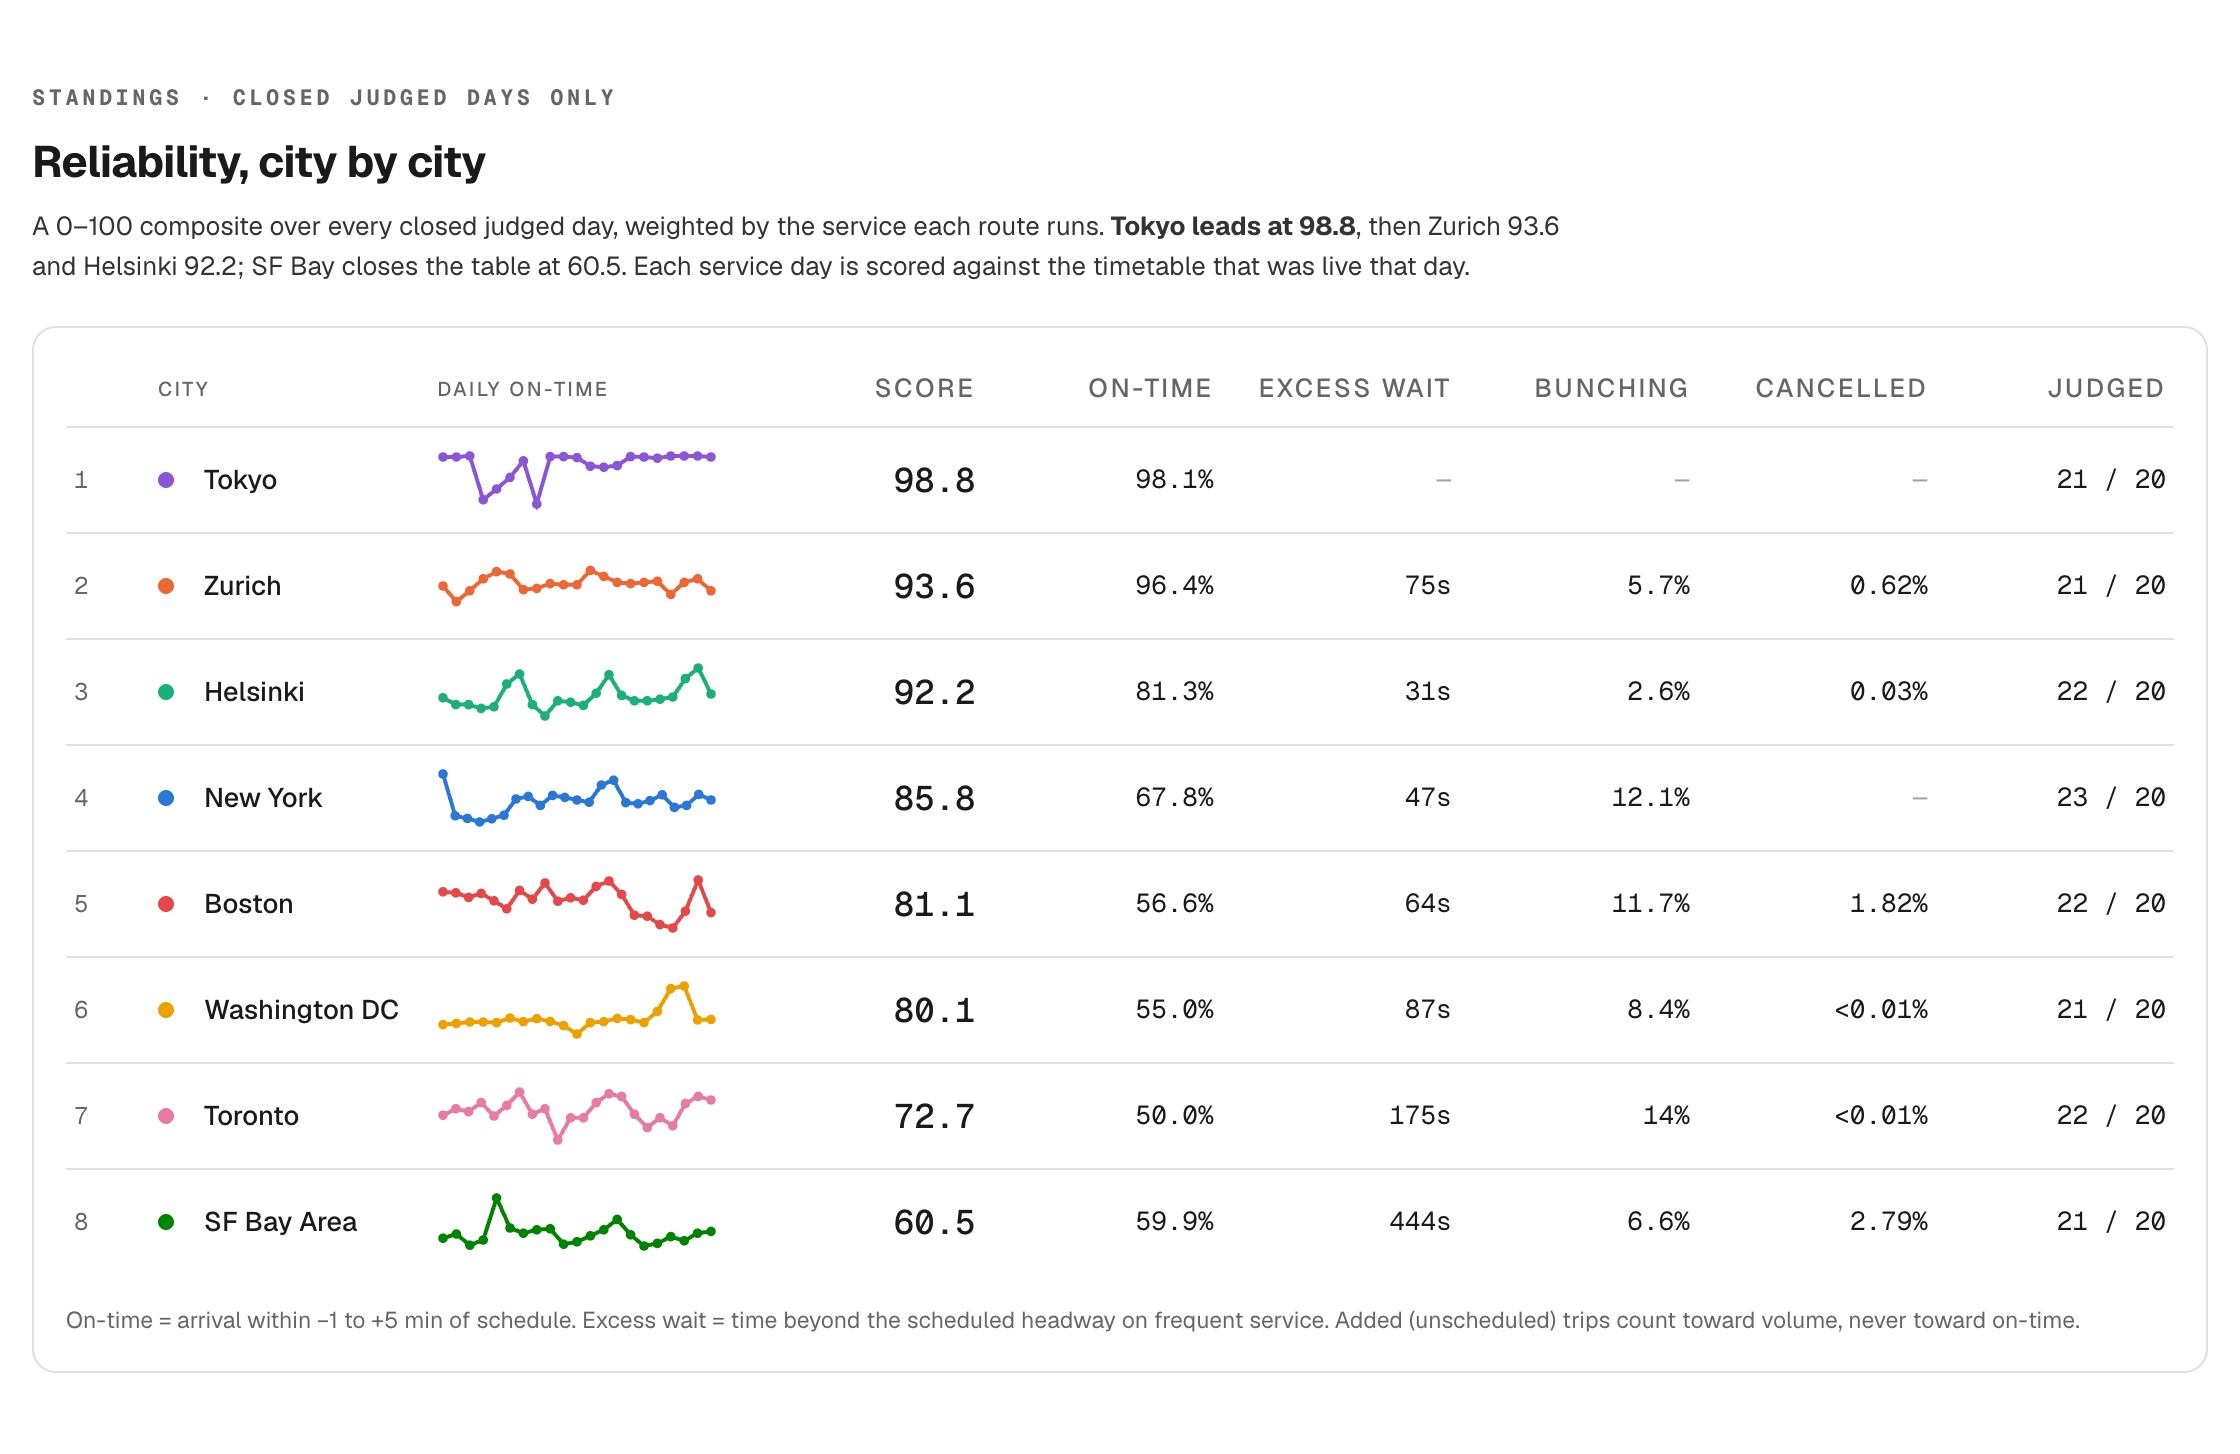
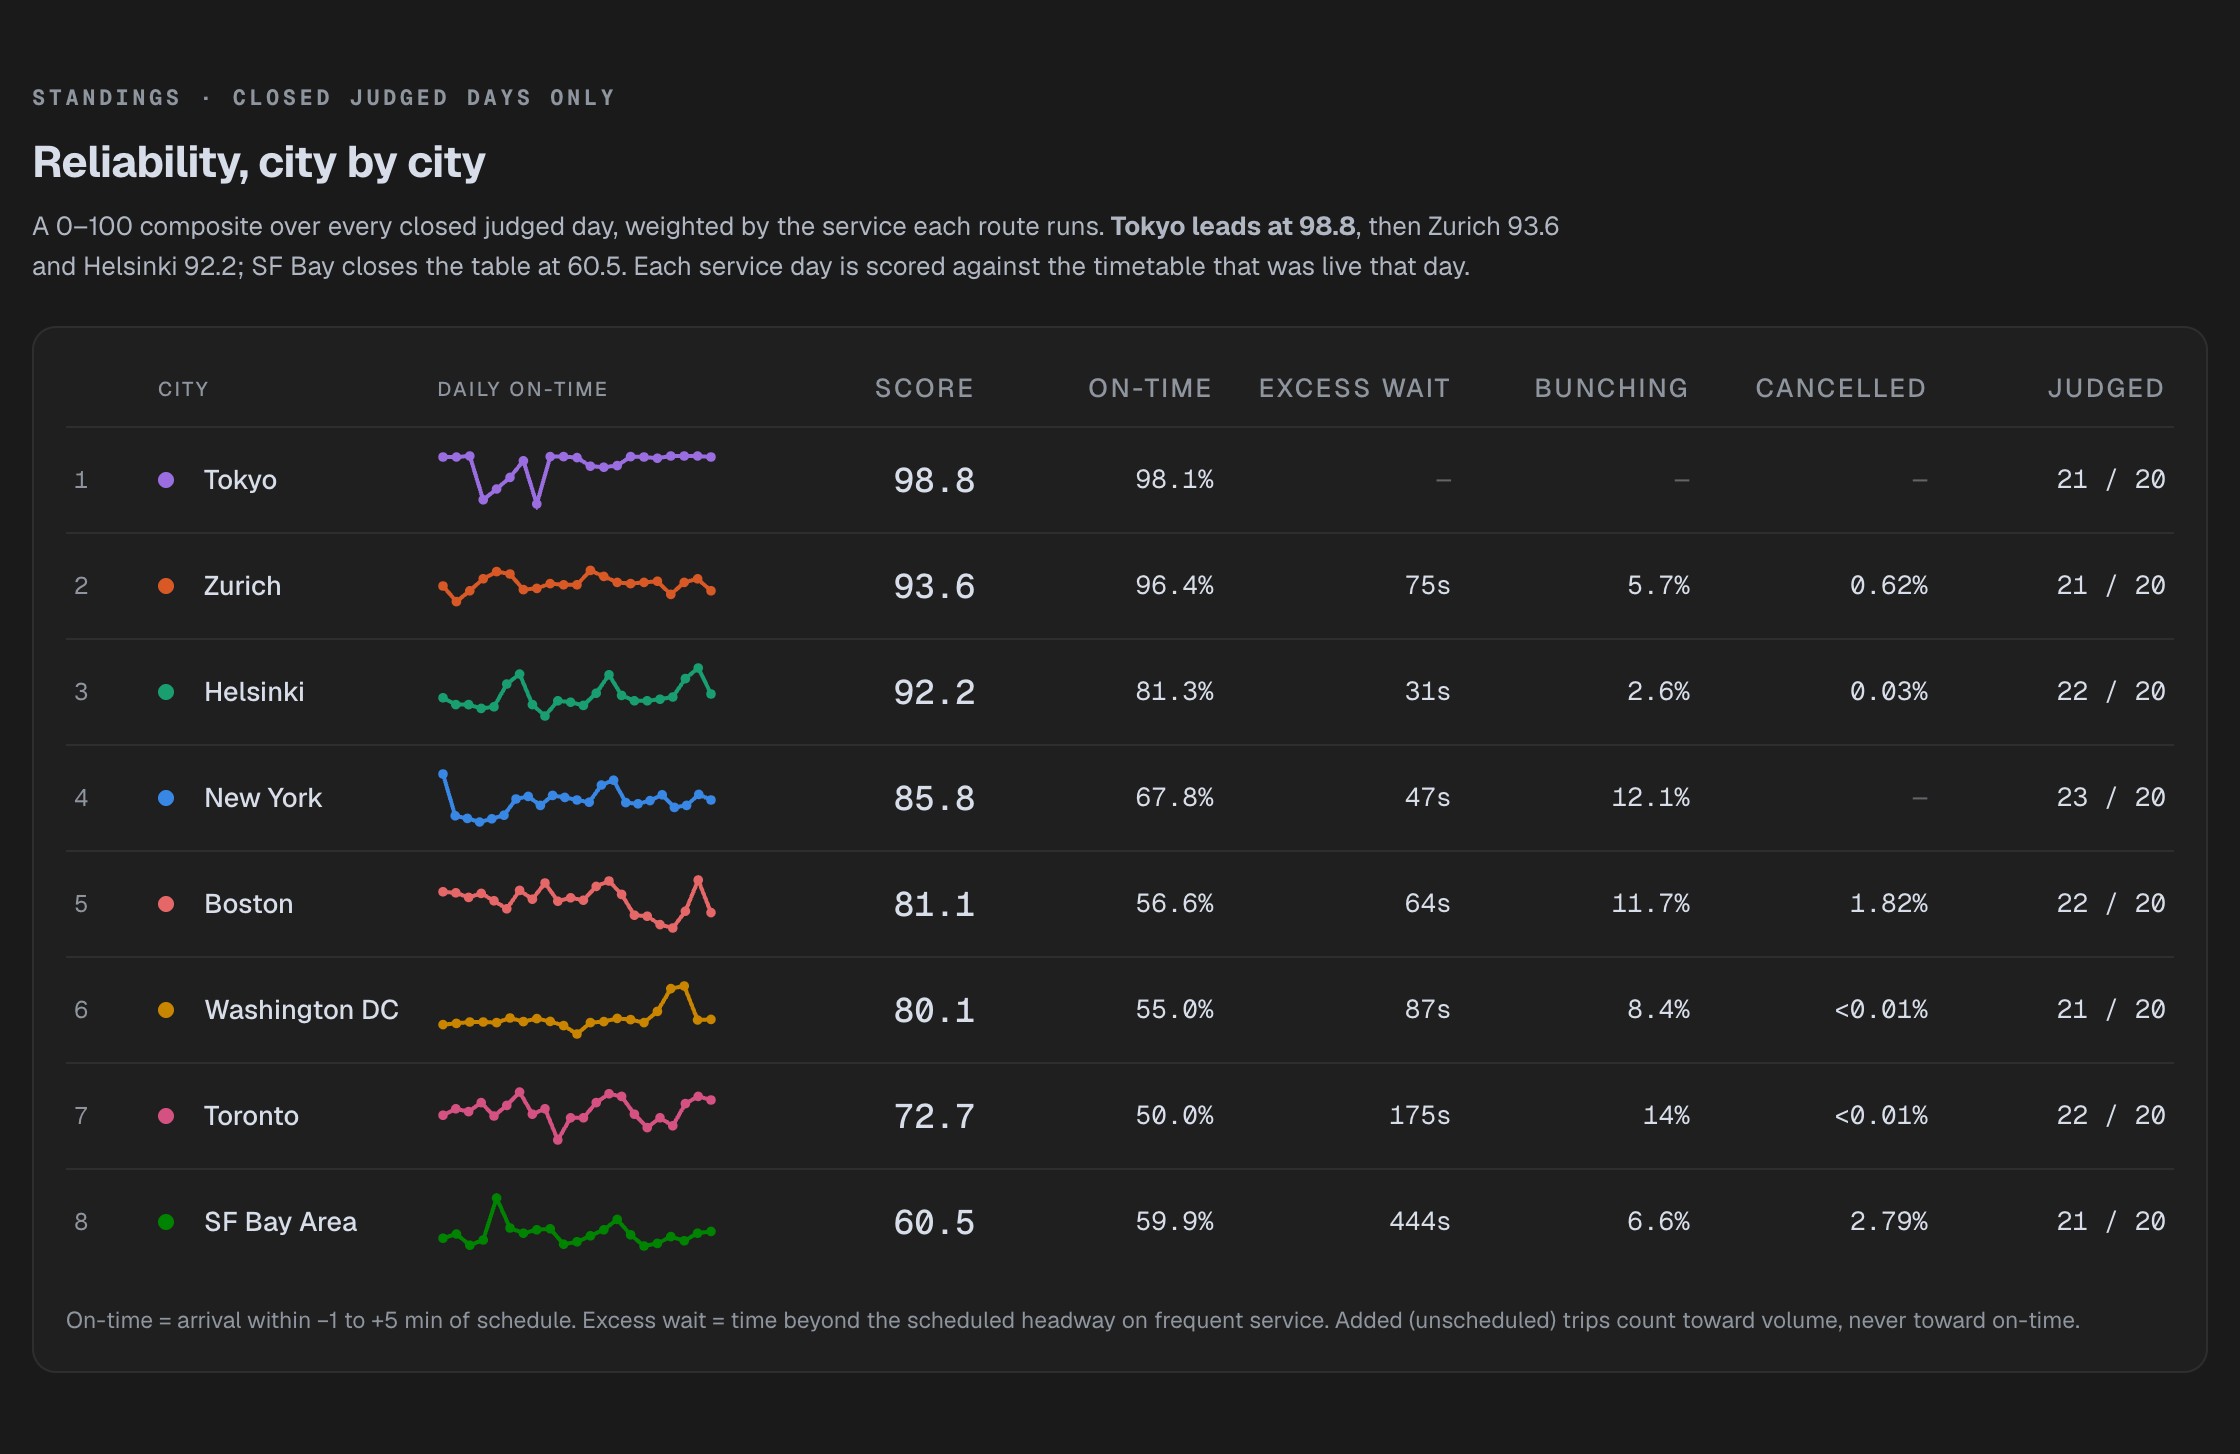
Reliability, city by city — the published answer.
- Tokyo leads at 98.8 with 98.1% on time; SF Bay closes the table at 60.5 with 444 seconds of excess wait, roughly six times Zurich's 75.
- The judged-days column is the evidence gate made visible: every ranked city shows 21 to 23 closed days against a minimum of 20.
- The dashes are deliberate. Tokyo's feed carries no excess-wait, bunching, or cancellation signal, so those cells stay NULL instead of reading as a perfect zero.
Key Features
- Eight cities and five countries normalized into one schema — MTA, MBTA, WMATA, 511.org's ~30 Bay Area operators, TTC, HSL, opentransportdata.swiss, and ODPT, all ingested by a single config-driven poller image
- Per-city trip identity resolution — a custom matcher for New York's drifting origin-time ids, identity rebuilt from route/direction/date/start for Helsinki's empty trip_id, cross-namespace stop mapping for Toronto, a 615-route allow-list carved out of Zurich's 5,122-route national feed, and station-transition arrival detection for Tokyo's schedule-free train JSON
- Arrival finalization across 2.19 billion prediction rows, selecting one row per trip and stop from feeds that restate each stop up to 49 times
- Scores gated on evidence — a city stays unranked until it banks 20 closed judged days, and a metric its feed cannot support is published as NULL
- Point-in-time schedule versions with a rotation freeze, pinning each finalized day to the timetable it was observed against so a mid-window calendar rotation cannot restate it
- Convergent re-runs — silver dedupes inside a two-hour watermark and dbt facts are incremental on a 72-hour lookback; after a static rotation drifted retired cities' numbers, one chain restored every figure exactly, int_trip_matching back to 2,091,844 rows and Boston back to 81.1
- 242 dbt tests and 235 Dagster asset checks on every warehouse build, a feed-freshness tripwire every 15 minutes, and CloudWatch alarms that reboot a wedged instance rather than page about it
Stack
- Python 3.12
- Apache Kafka 3.8
- Spark Structured Streaming
- EMR Serverless 7.5
- Apache Iceberg
- Amazon S3
- Snowflake
- dbt-core 1.11
- Dagster 1.13
- Terraform
- Docker
- MapLibre
- deck.gl
- Streamlit
Architecture
Thirty endpoints are polled every 30 seconds by eight containers built from one image, differing only in configuration; SF Bay polls at 200 seconds to stay under a 60-request-per-hour key cap. Every HTTP response is written to S3 before anything decodes it, so each layer can be rebuilt from the one above without asking an agency for data it will not serve twice. Kafka sits between polling and processing for a specific reason: polling must never block on downstream work, and its 24-hour retention both buffers the two-hour drain cycle and makes replay possible.
Processing runs every two hours as an availableNow drain on EMR Serverless, which bills per run with no idle cluster — drains took 7 to 10 minutes at full eight-city load, about $21 a month. The landing format is Iceberg on S3 under a Hadoop catalog, chosen for append-heavy streams with a dedupe watermark and for schema evolution across eight differently-shaped feeds. Snowflake reads silver in place as external tables, which removes the load step entirely; above it, 50 dbt models and 242 tests run on an X-Small warehouse that auto-suspends after 60 seconds, consuming 168.5 credits over 36 days.
Dagster runs on a t4g.medium alongside Postgres and the pollers, with Kafka isolated on a t4g.small so a deploy or a poller restart cannot take the buffer down with it. Five schedules and three sensors cover the finite work: a weekly static GTFS refresh, feed freshness four times an hour, the two-hour silver drain, the twice-daily warehouse chain, and hourly weather. Total AWS usage from August 22 to September 25 was $143.71, averaging $4.11 a day — roughly $14 a day through the opening backfill and $2 a day once the pollers retired.
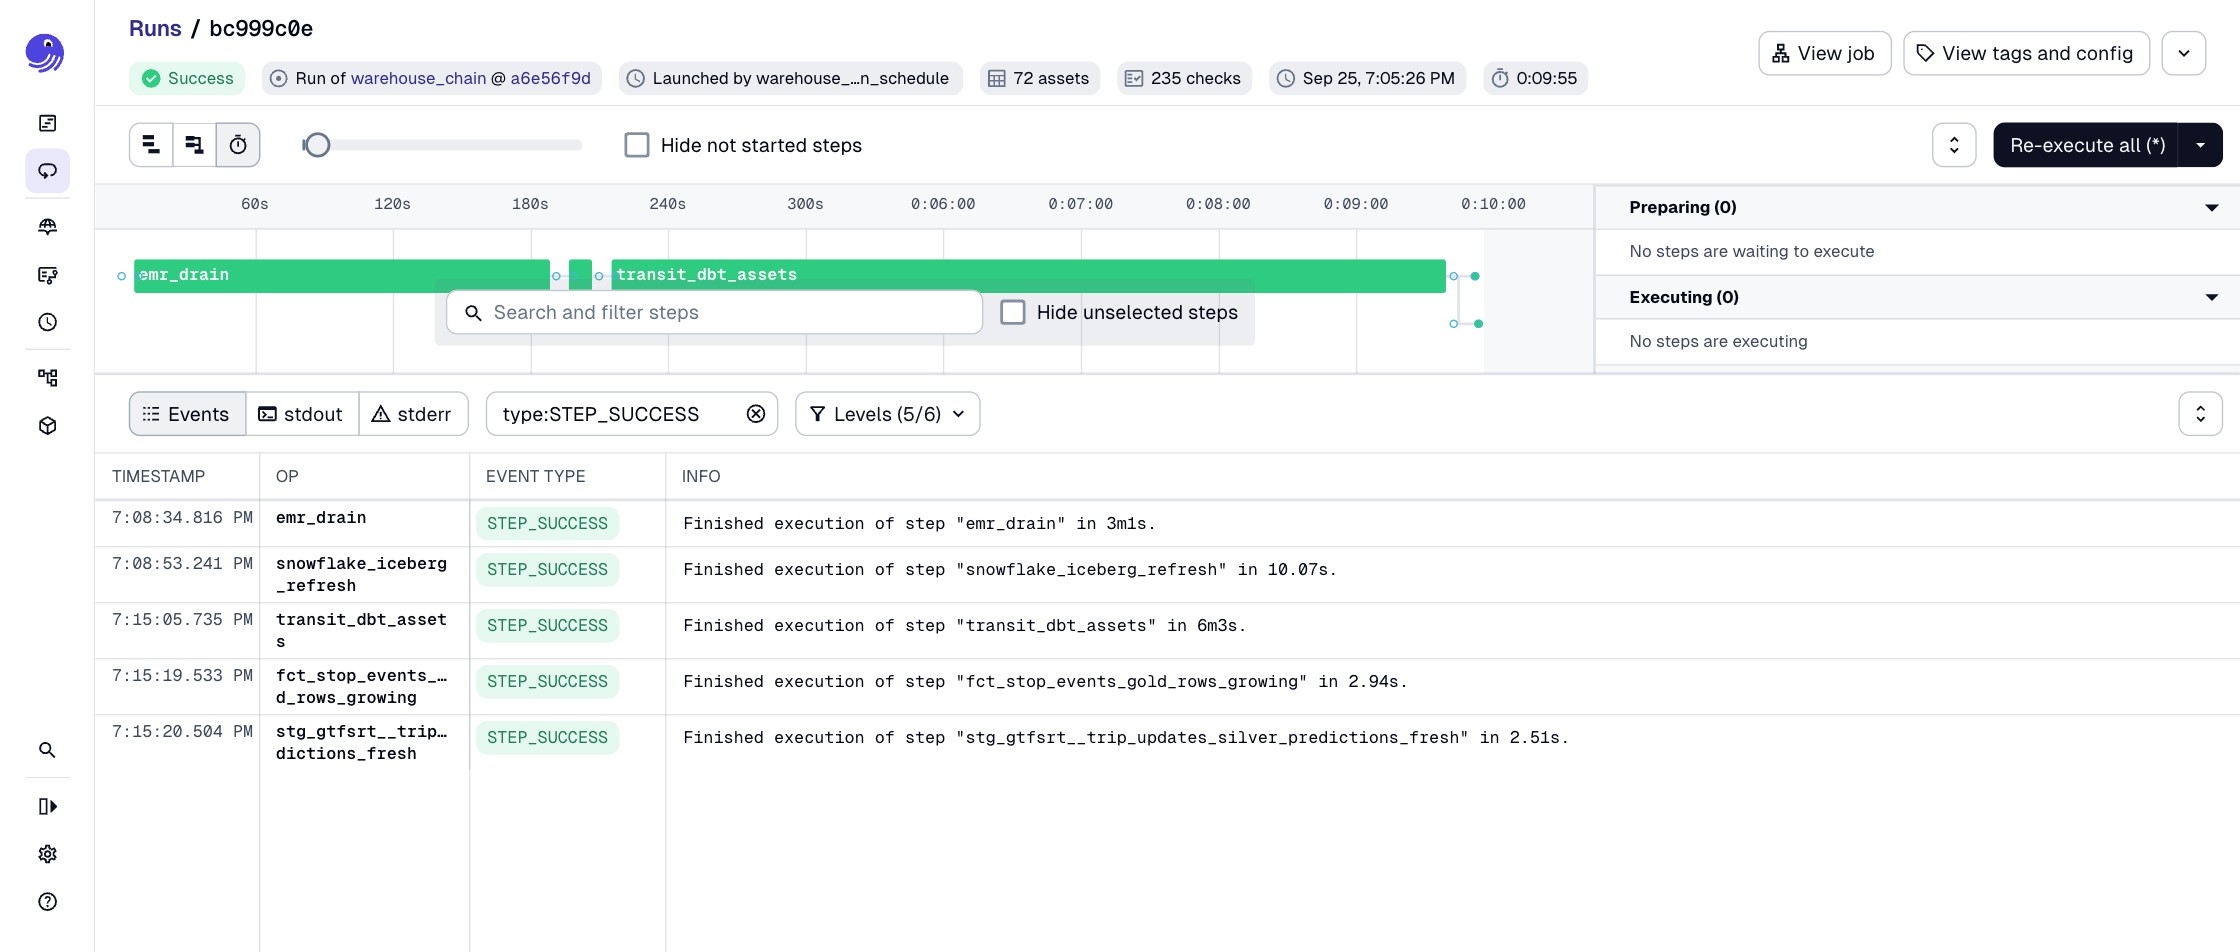
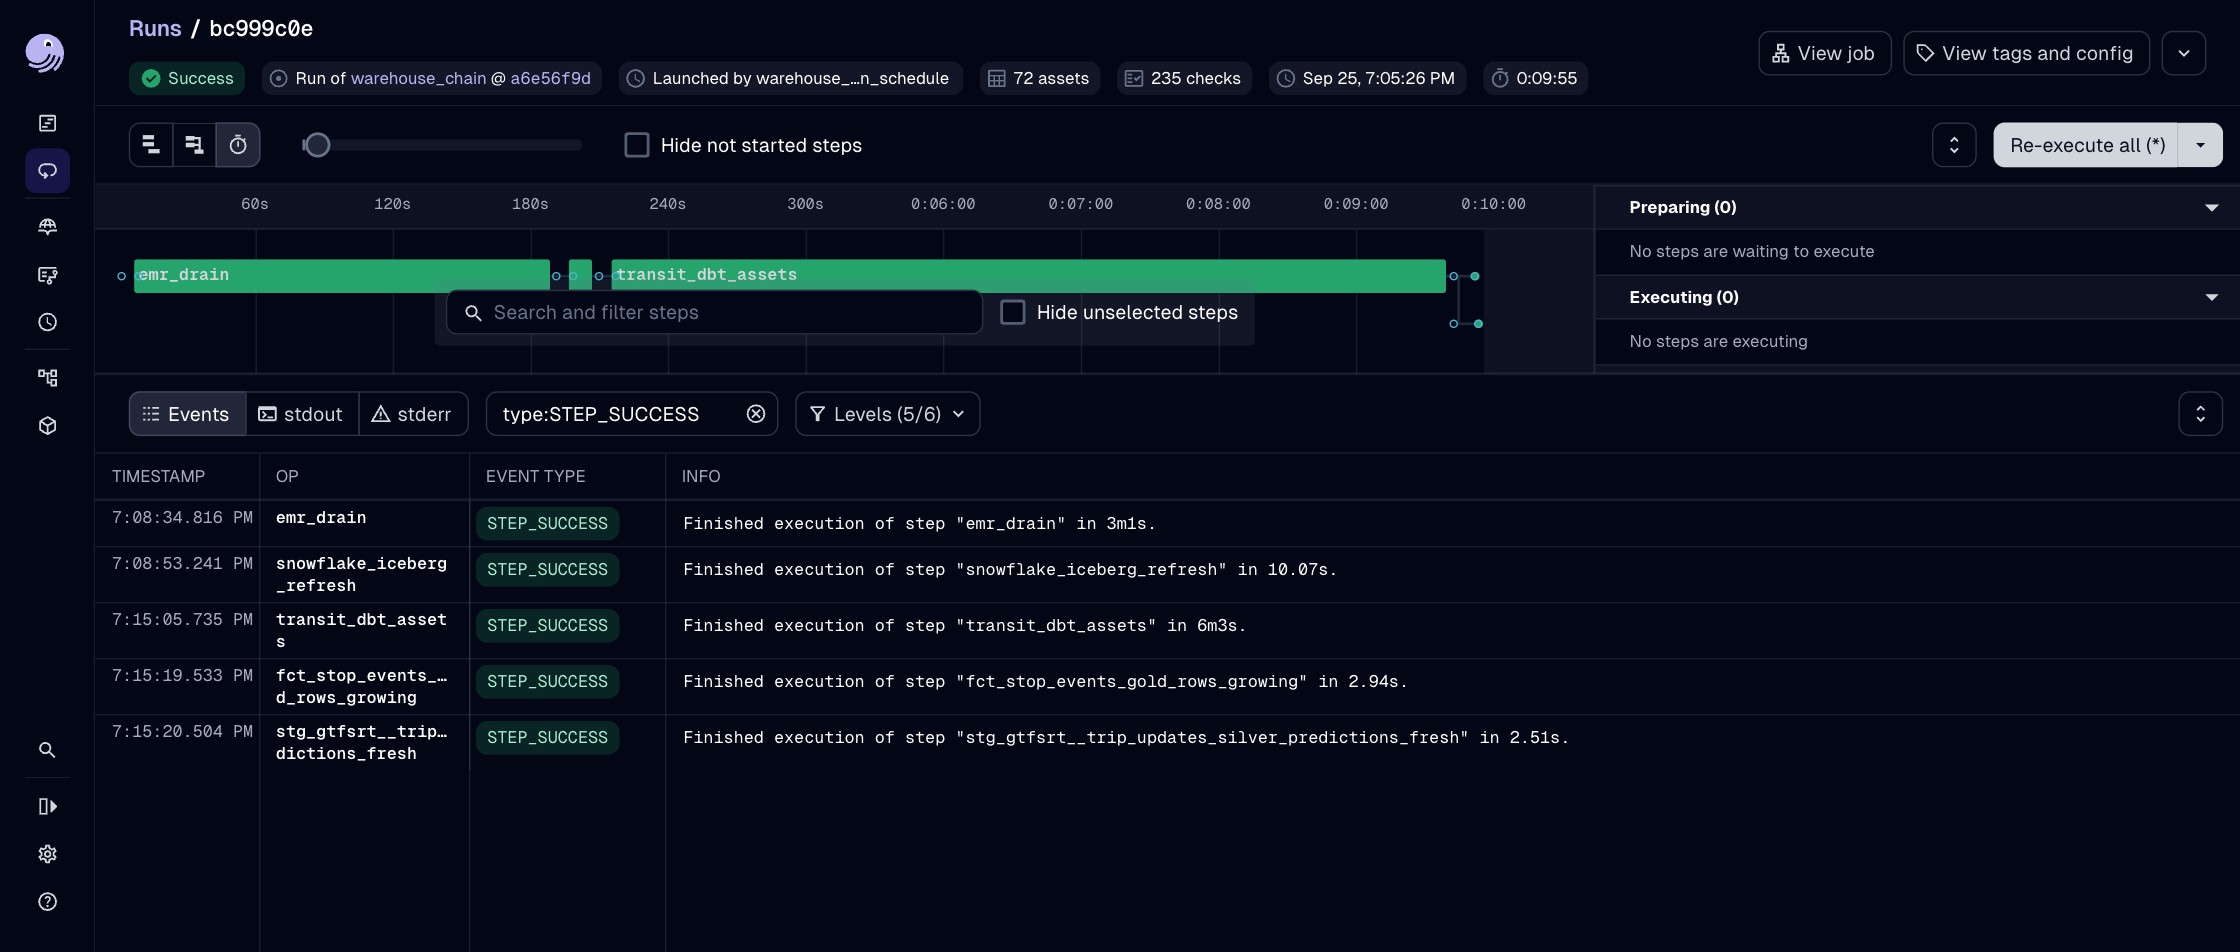
One warehouse chain, 9 minutes 55 seconds end to end.
- Run bc999c0e, launched by warehouse_chain_schedule at 7:05 PM ET: emr_drain 3m1s, snowflake_iceberg_refresh 10.07s, transit_dbt_assets 6m3s, then checks at 2.9 and 2.5 seconds.
- 72 assets and 235 checks in a single run. The checks are part of the chain itself, so a build that violates them fails as a build.
- The Gantt shows where the time goes: dbt is the long pole at six minutes, and the Iceberg refresh that makes silver visible to Snowflake costs ten seconds.
Skills Applied
- Streaming Ingestion
- Thirty agency endpoints on per-source cadences into Kafka, with a raw S3 archive written before any decode so every downstream layer stays rebuildable.
- Distributed Processing
- Spark Structured Streaming on EMR Serverless in availableNow drains, deduplicating inside a two-hour watermark and writing Iceberg tables on S3.
- Dimensional Modeling
- 50 dbt models over 2.96 billion silver rows, incremental facts on a 72-hour lookback, with per-agency trip identity resolved in the intermediate layer so the marts above it are written once.
- Orchestration
- Dagster schedules and sensors over the finite work, 235 asset checks per warehouse run, failure and recovery alerting, and a zombie-run reaper.
- Data Quality
- 242 dbt tests per build, evidence gates that withhold a score below 20 judged days, and NULL wherever a feed publishes nothing to measure.
- Cost Engineering
- A month of eight-city ingestion and processing held to $143.71 through per-run compute, a 60-second auto-suspend warehouse, lifecycle expiry on the raw archive, and two small ARM instances.
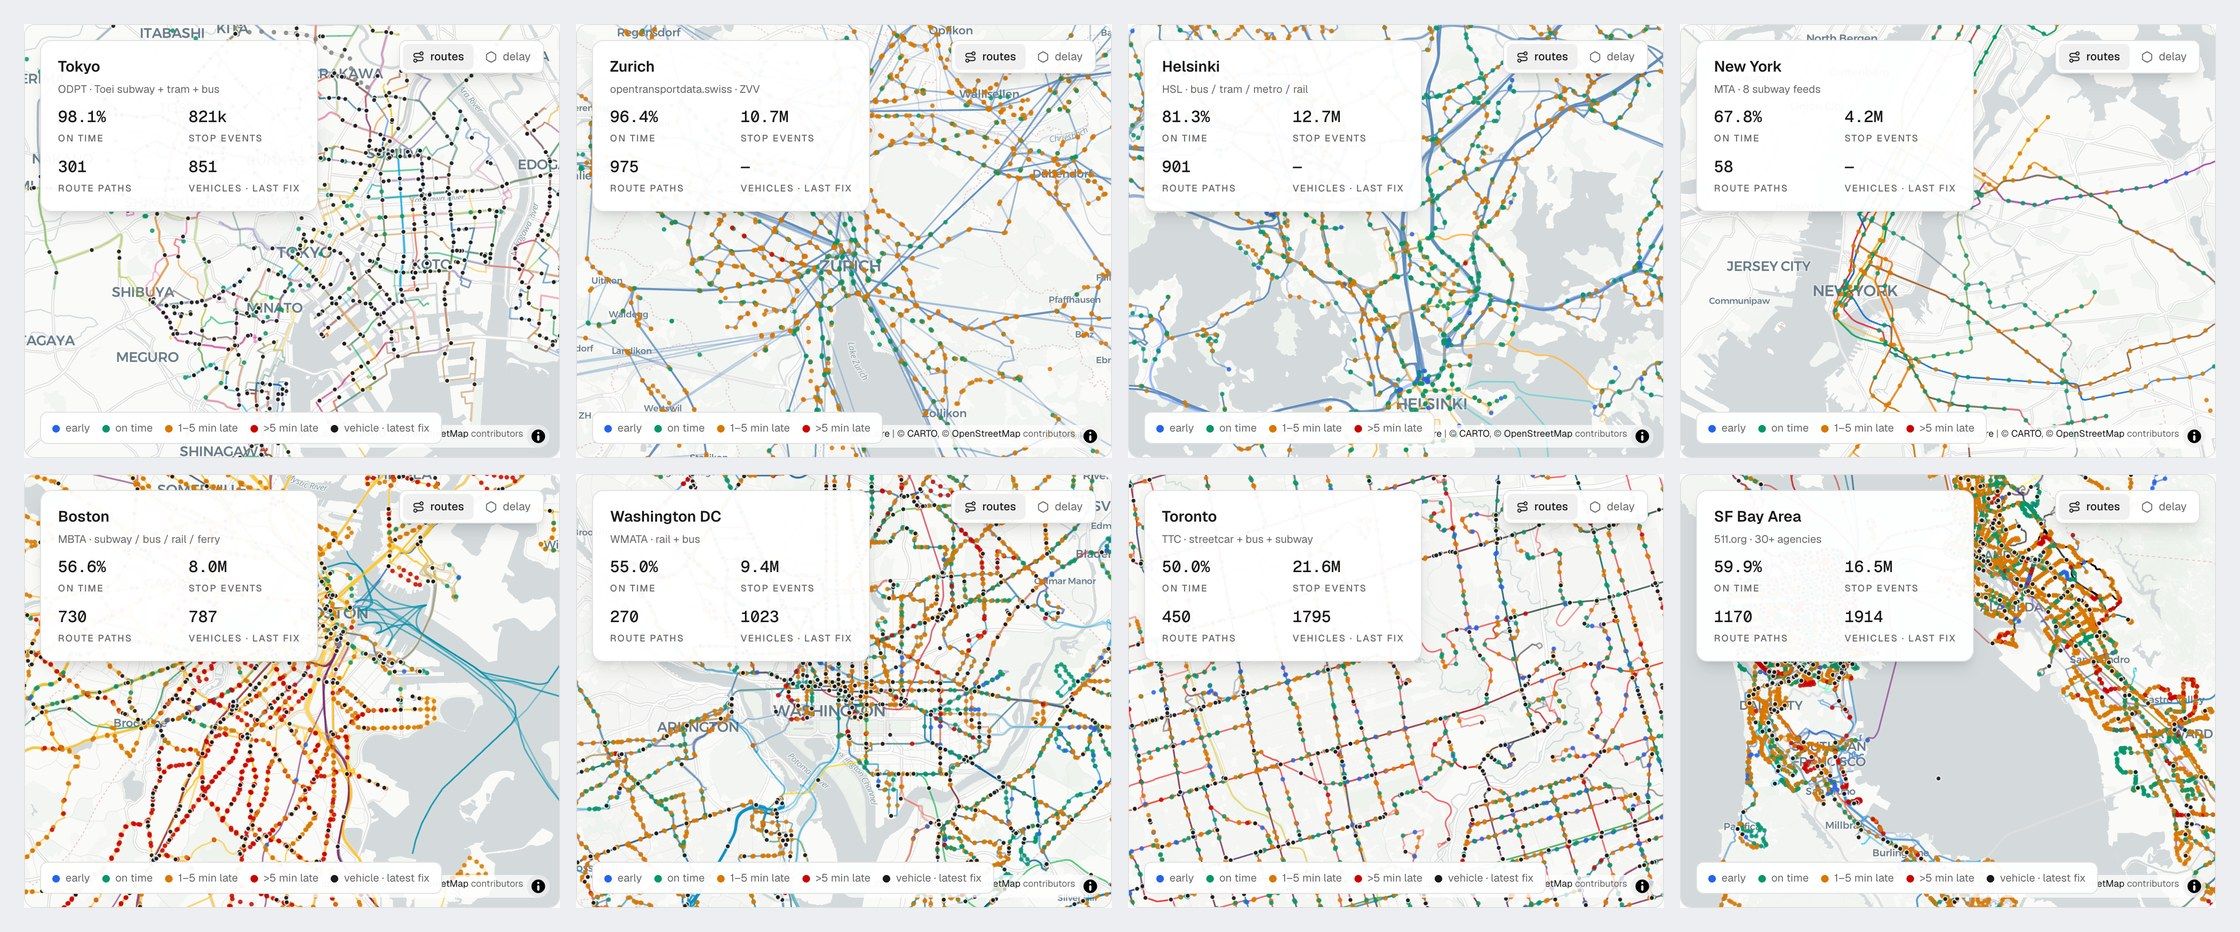
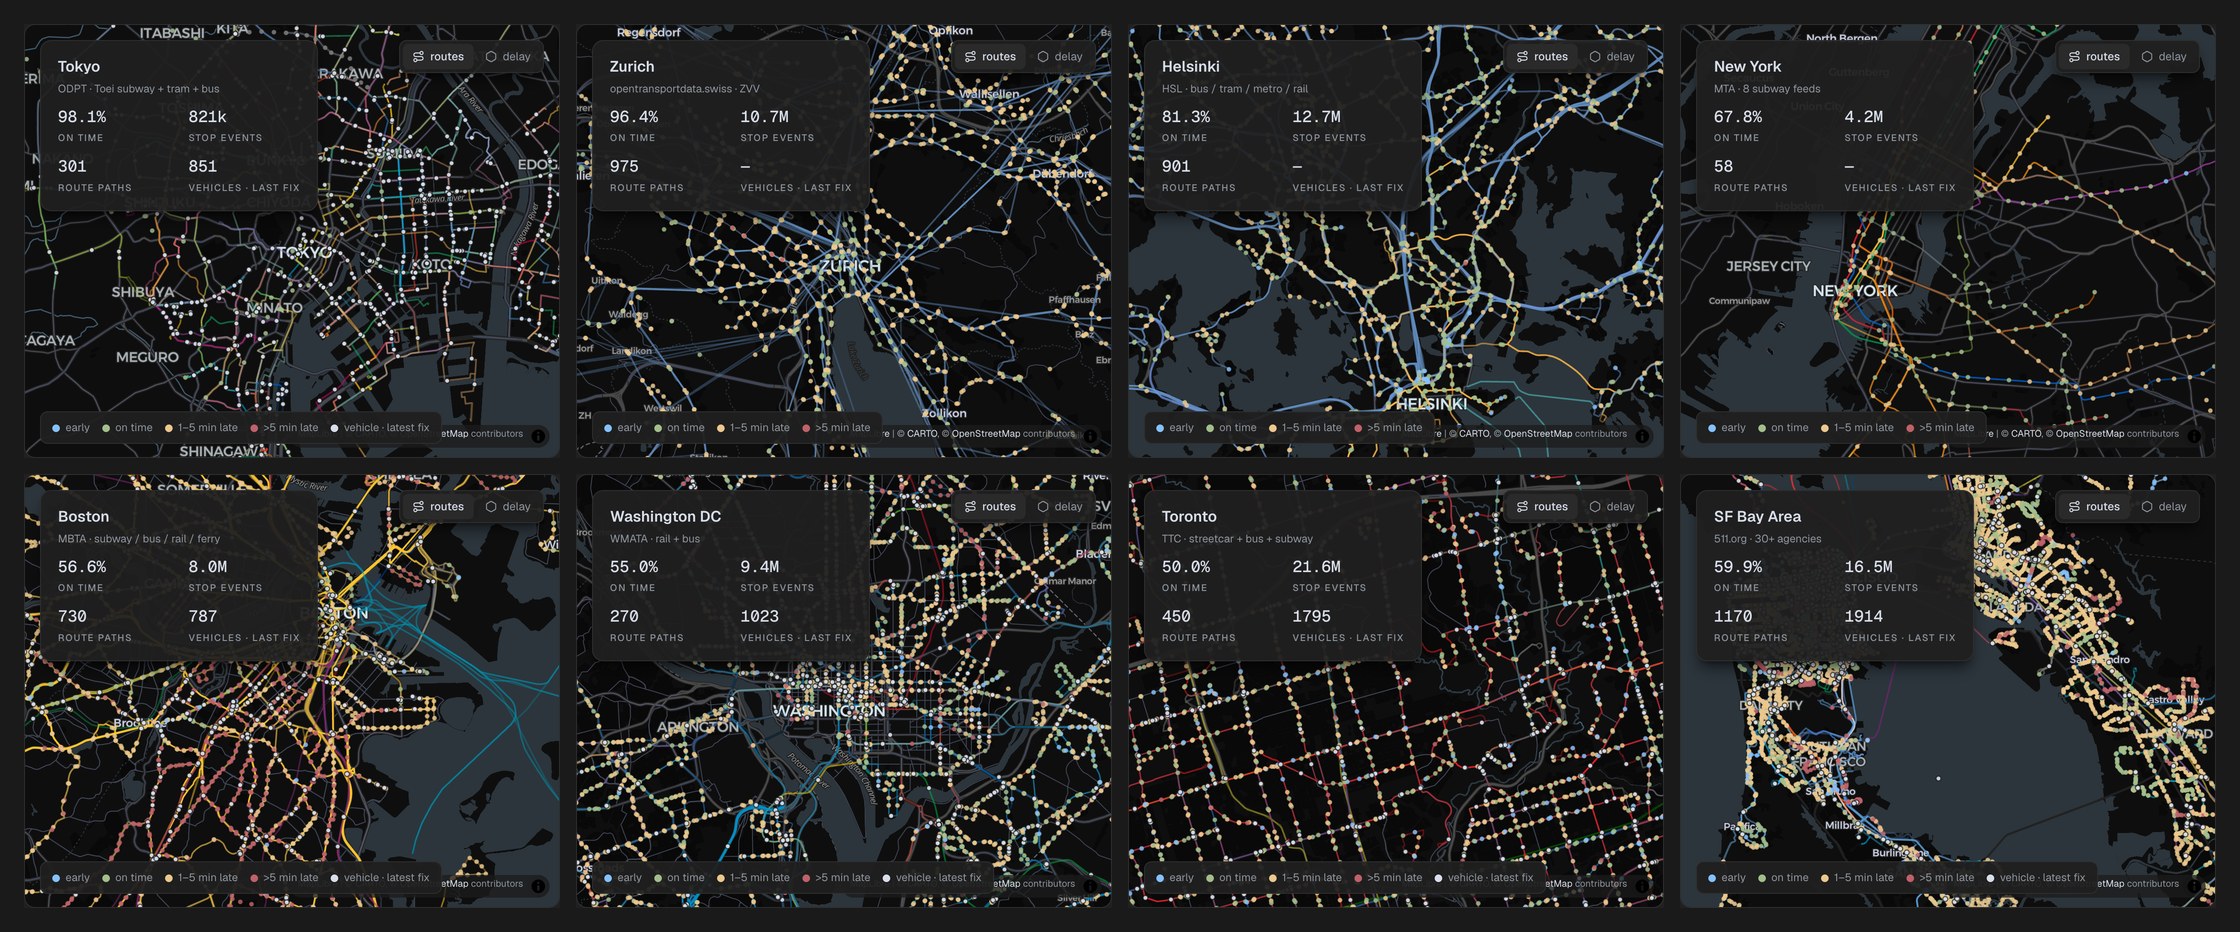
Eight networks, eight feed shapes, one measurement.
- On-time share spans 98.1% in Tokyo to 50.0% in Toronto, over stop-event counts running from Tokyo's 821k to Toronto's 21.6M.
- Route-path counts show how differently the feeds are built: SF Bay's 1,170 paths across roughly 30 operators against New York's 58.
- Four cities carry a vehicle count at the peak minute — Toronto 1,795, SF Bay 1,914 — and four show none, because their feeds publish no vehicle positions.
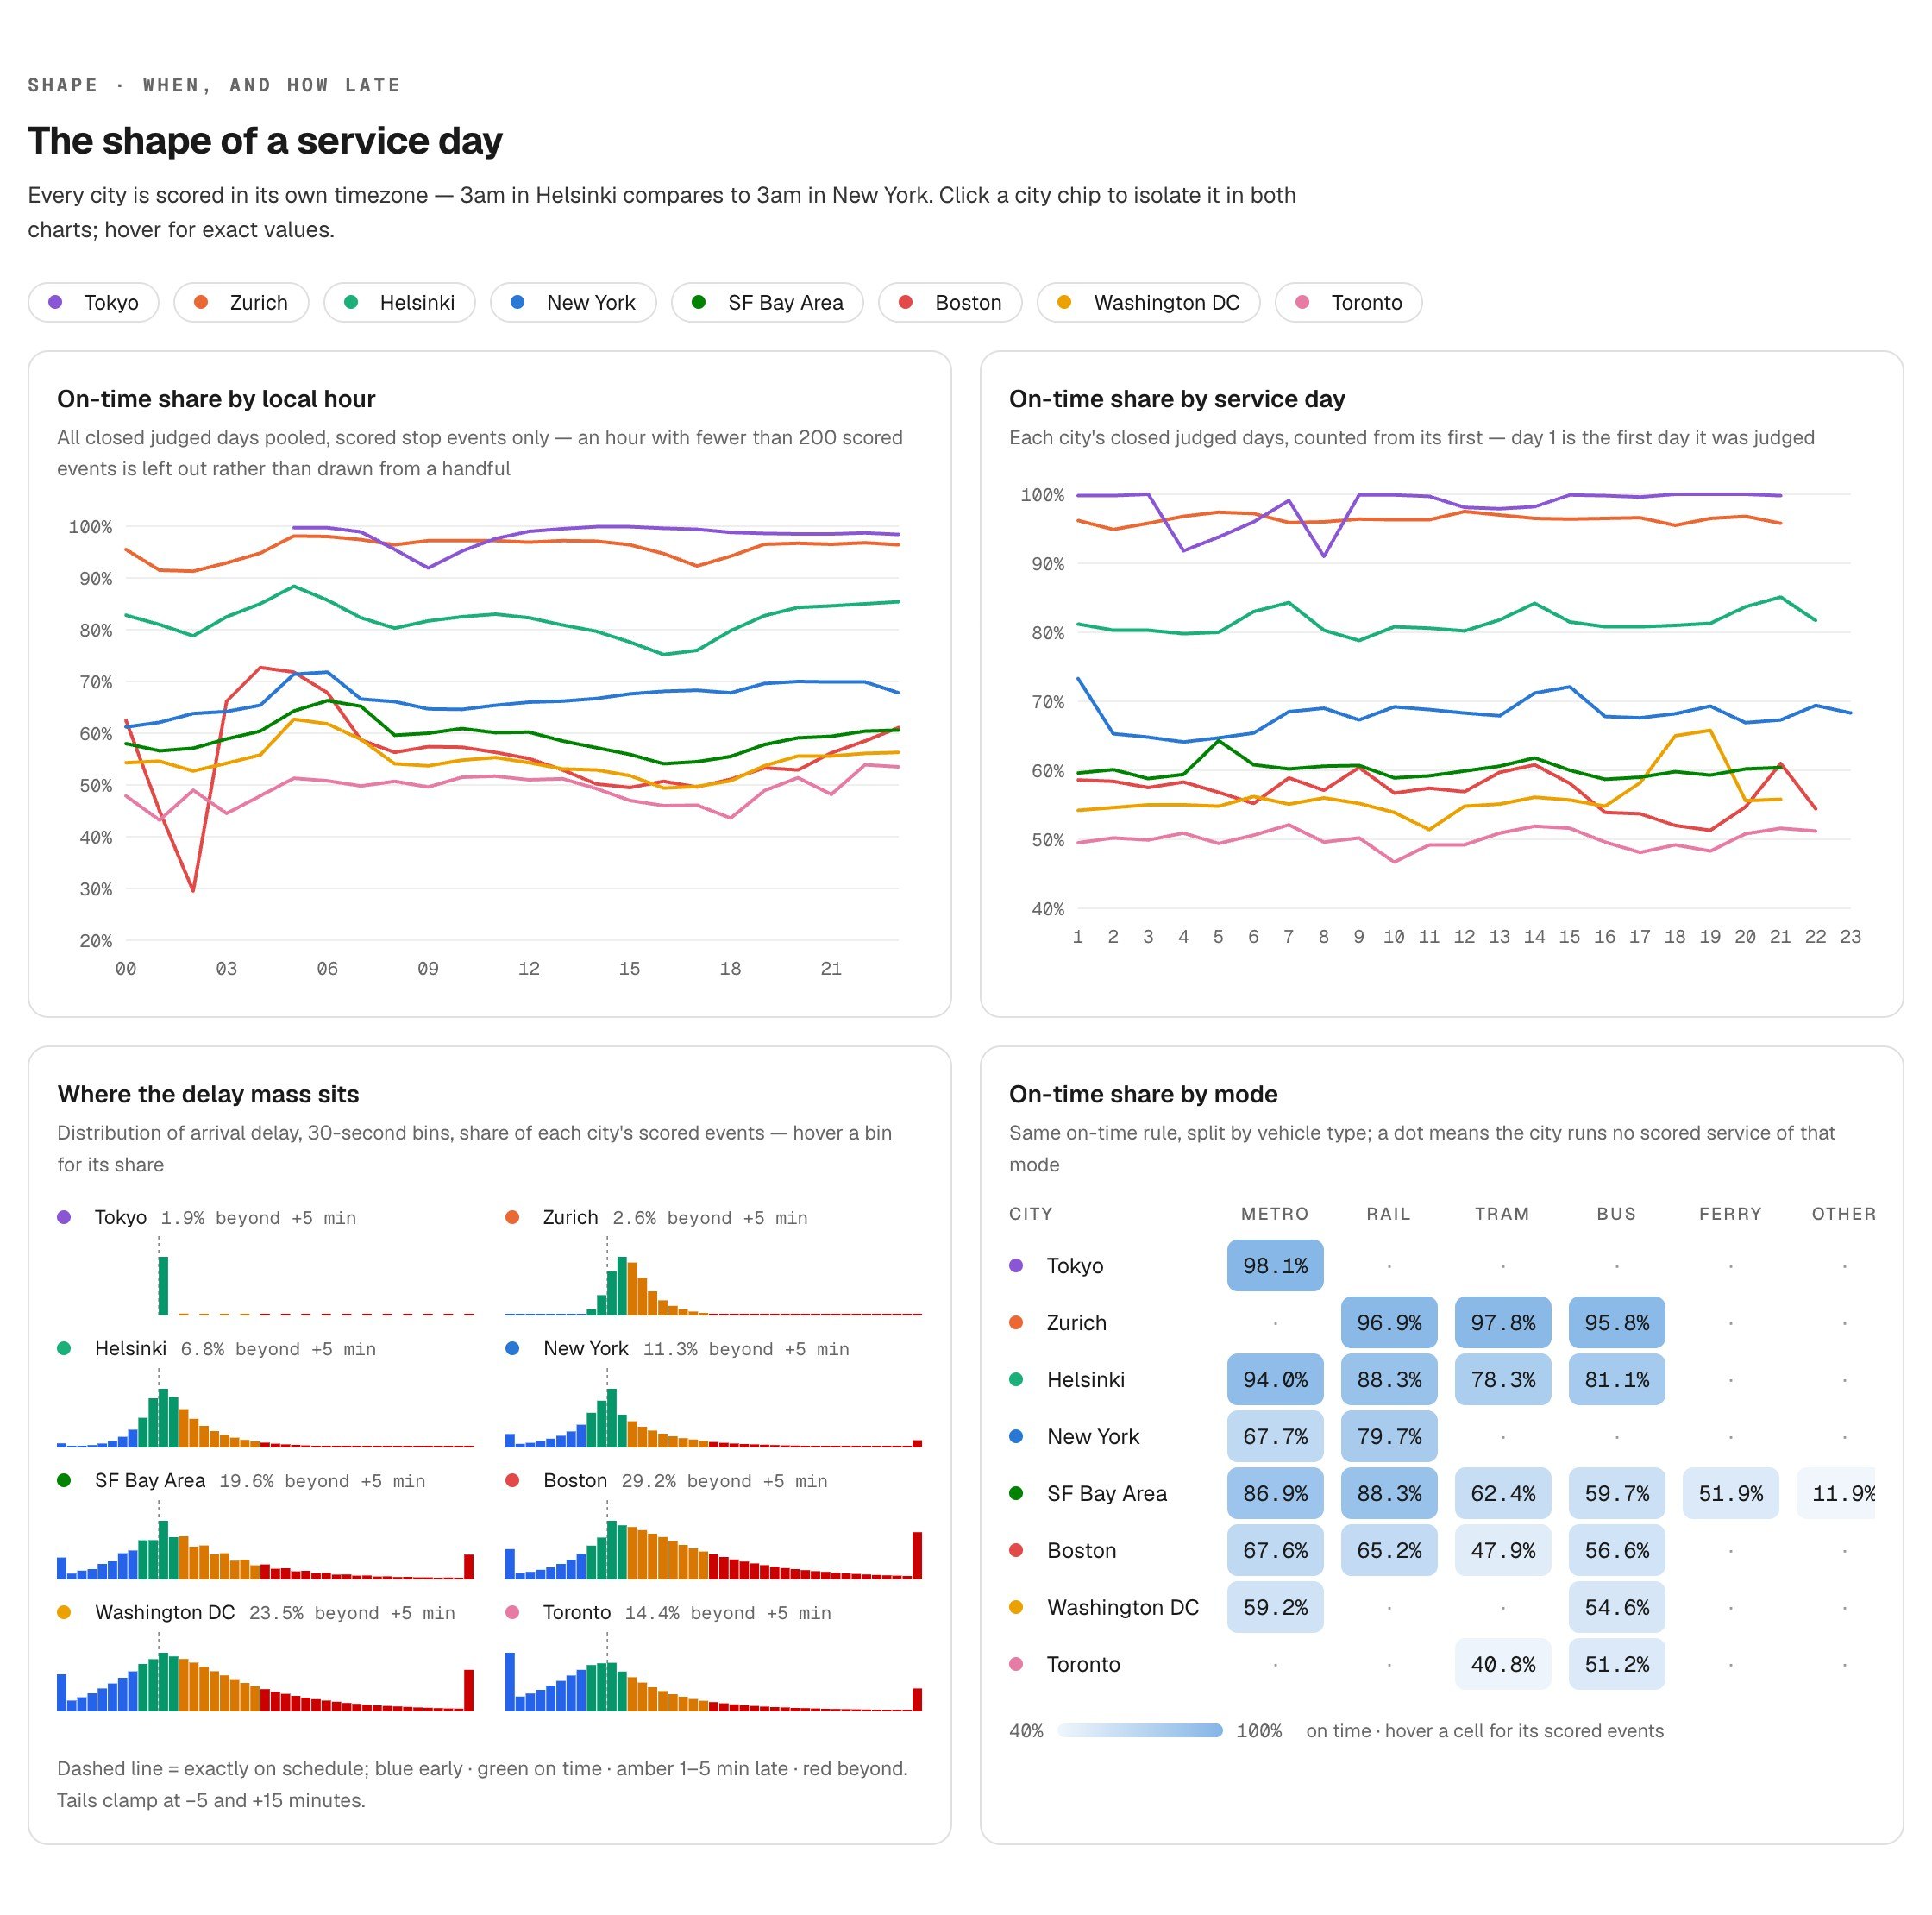
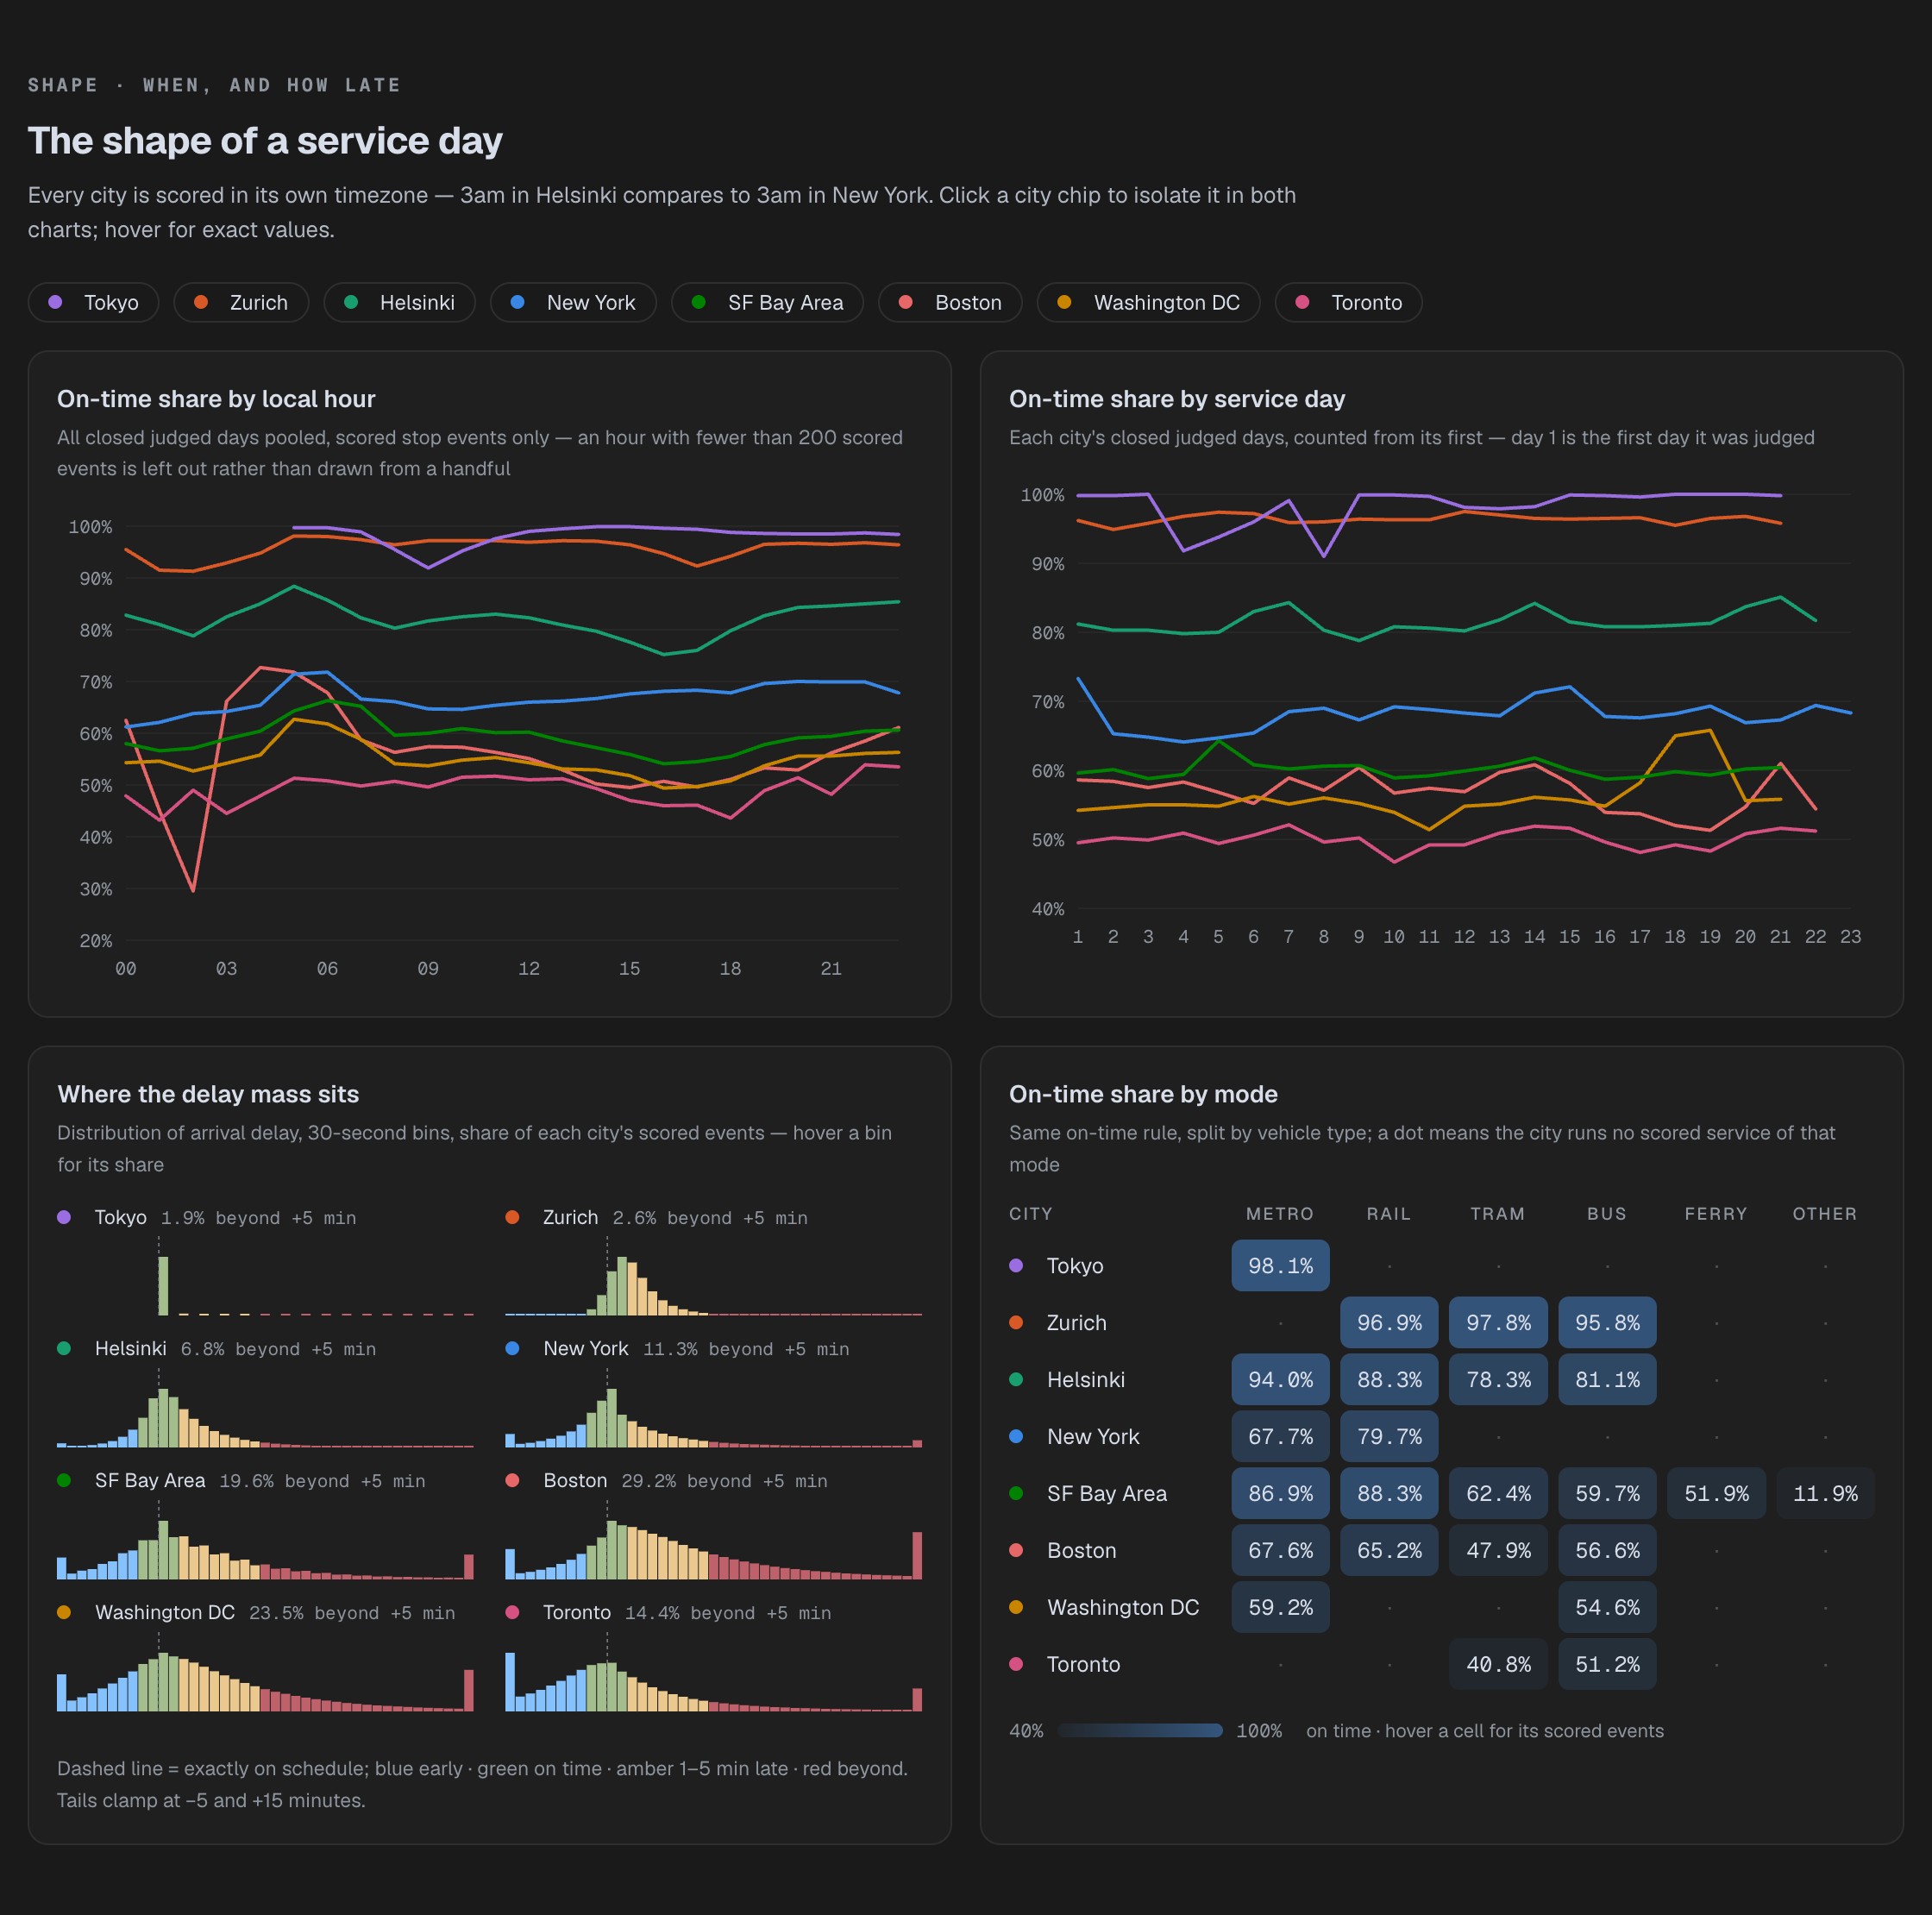
When and where service degrades.
- Delay distribution in 30-second bins gives the share beyond +5 minutes: Tokyo 1.9%, Zurich 2.6%, Helsinki 6.8%, New York 11.3%, Toronto 14.4%, SF Bay 19.6%, Washington DC 23.5%, Boston 29.2%.
- On-time share runs by local hour with each city in its own timezone, so the morning peak lines up across five countries.
- By mode, the spread inside one city can exceed the spread between cities: Toronto tram at 40.8% against Tokyo metro at 98.1% and Zurich tram at 97.8%.
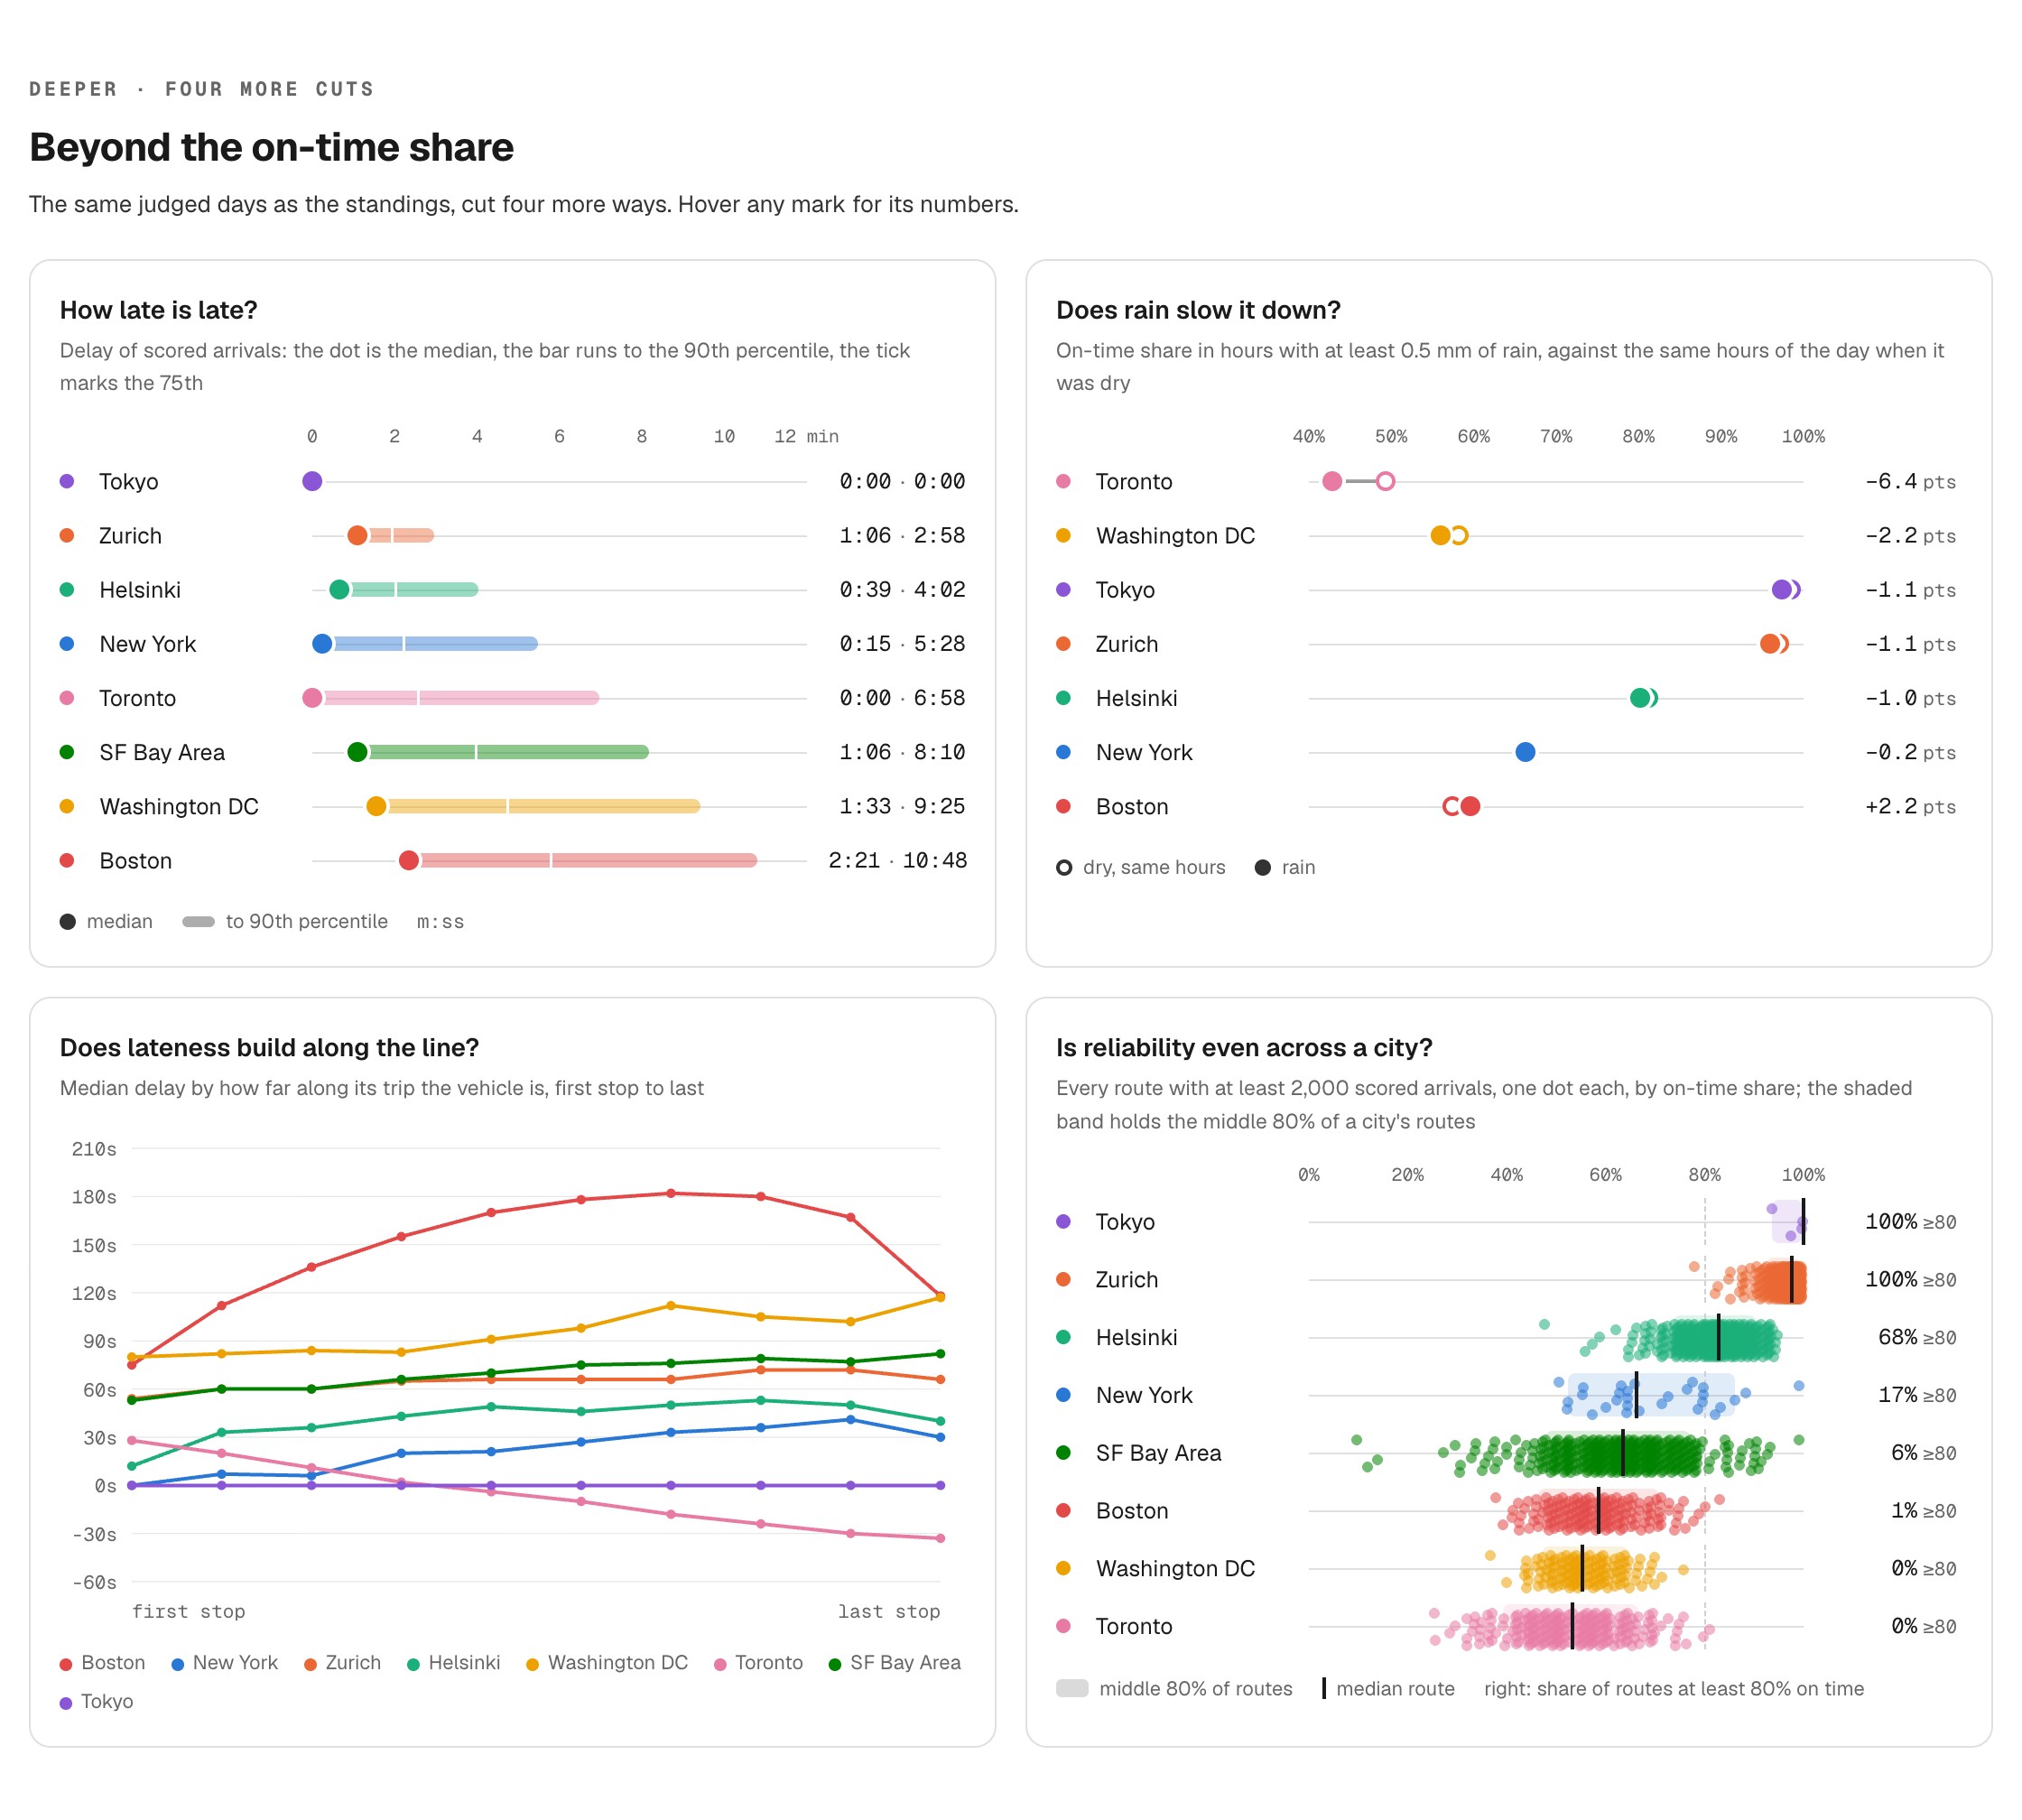
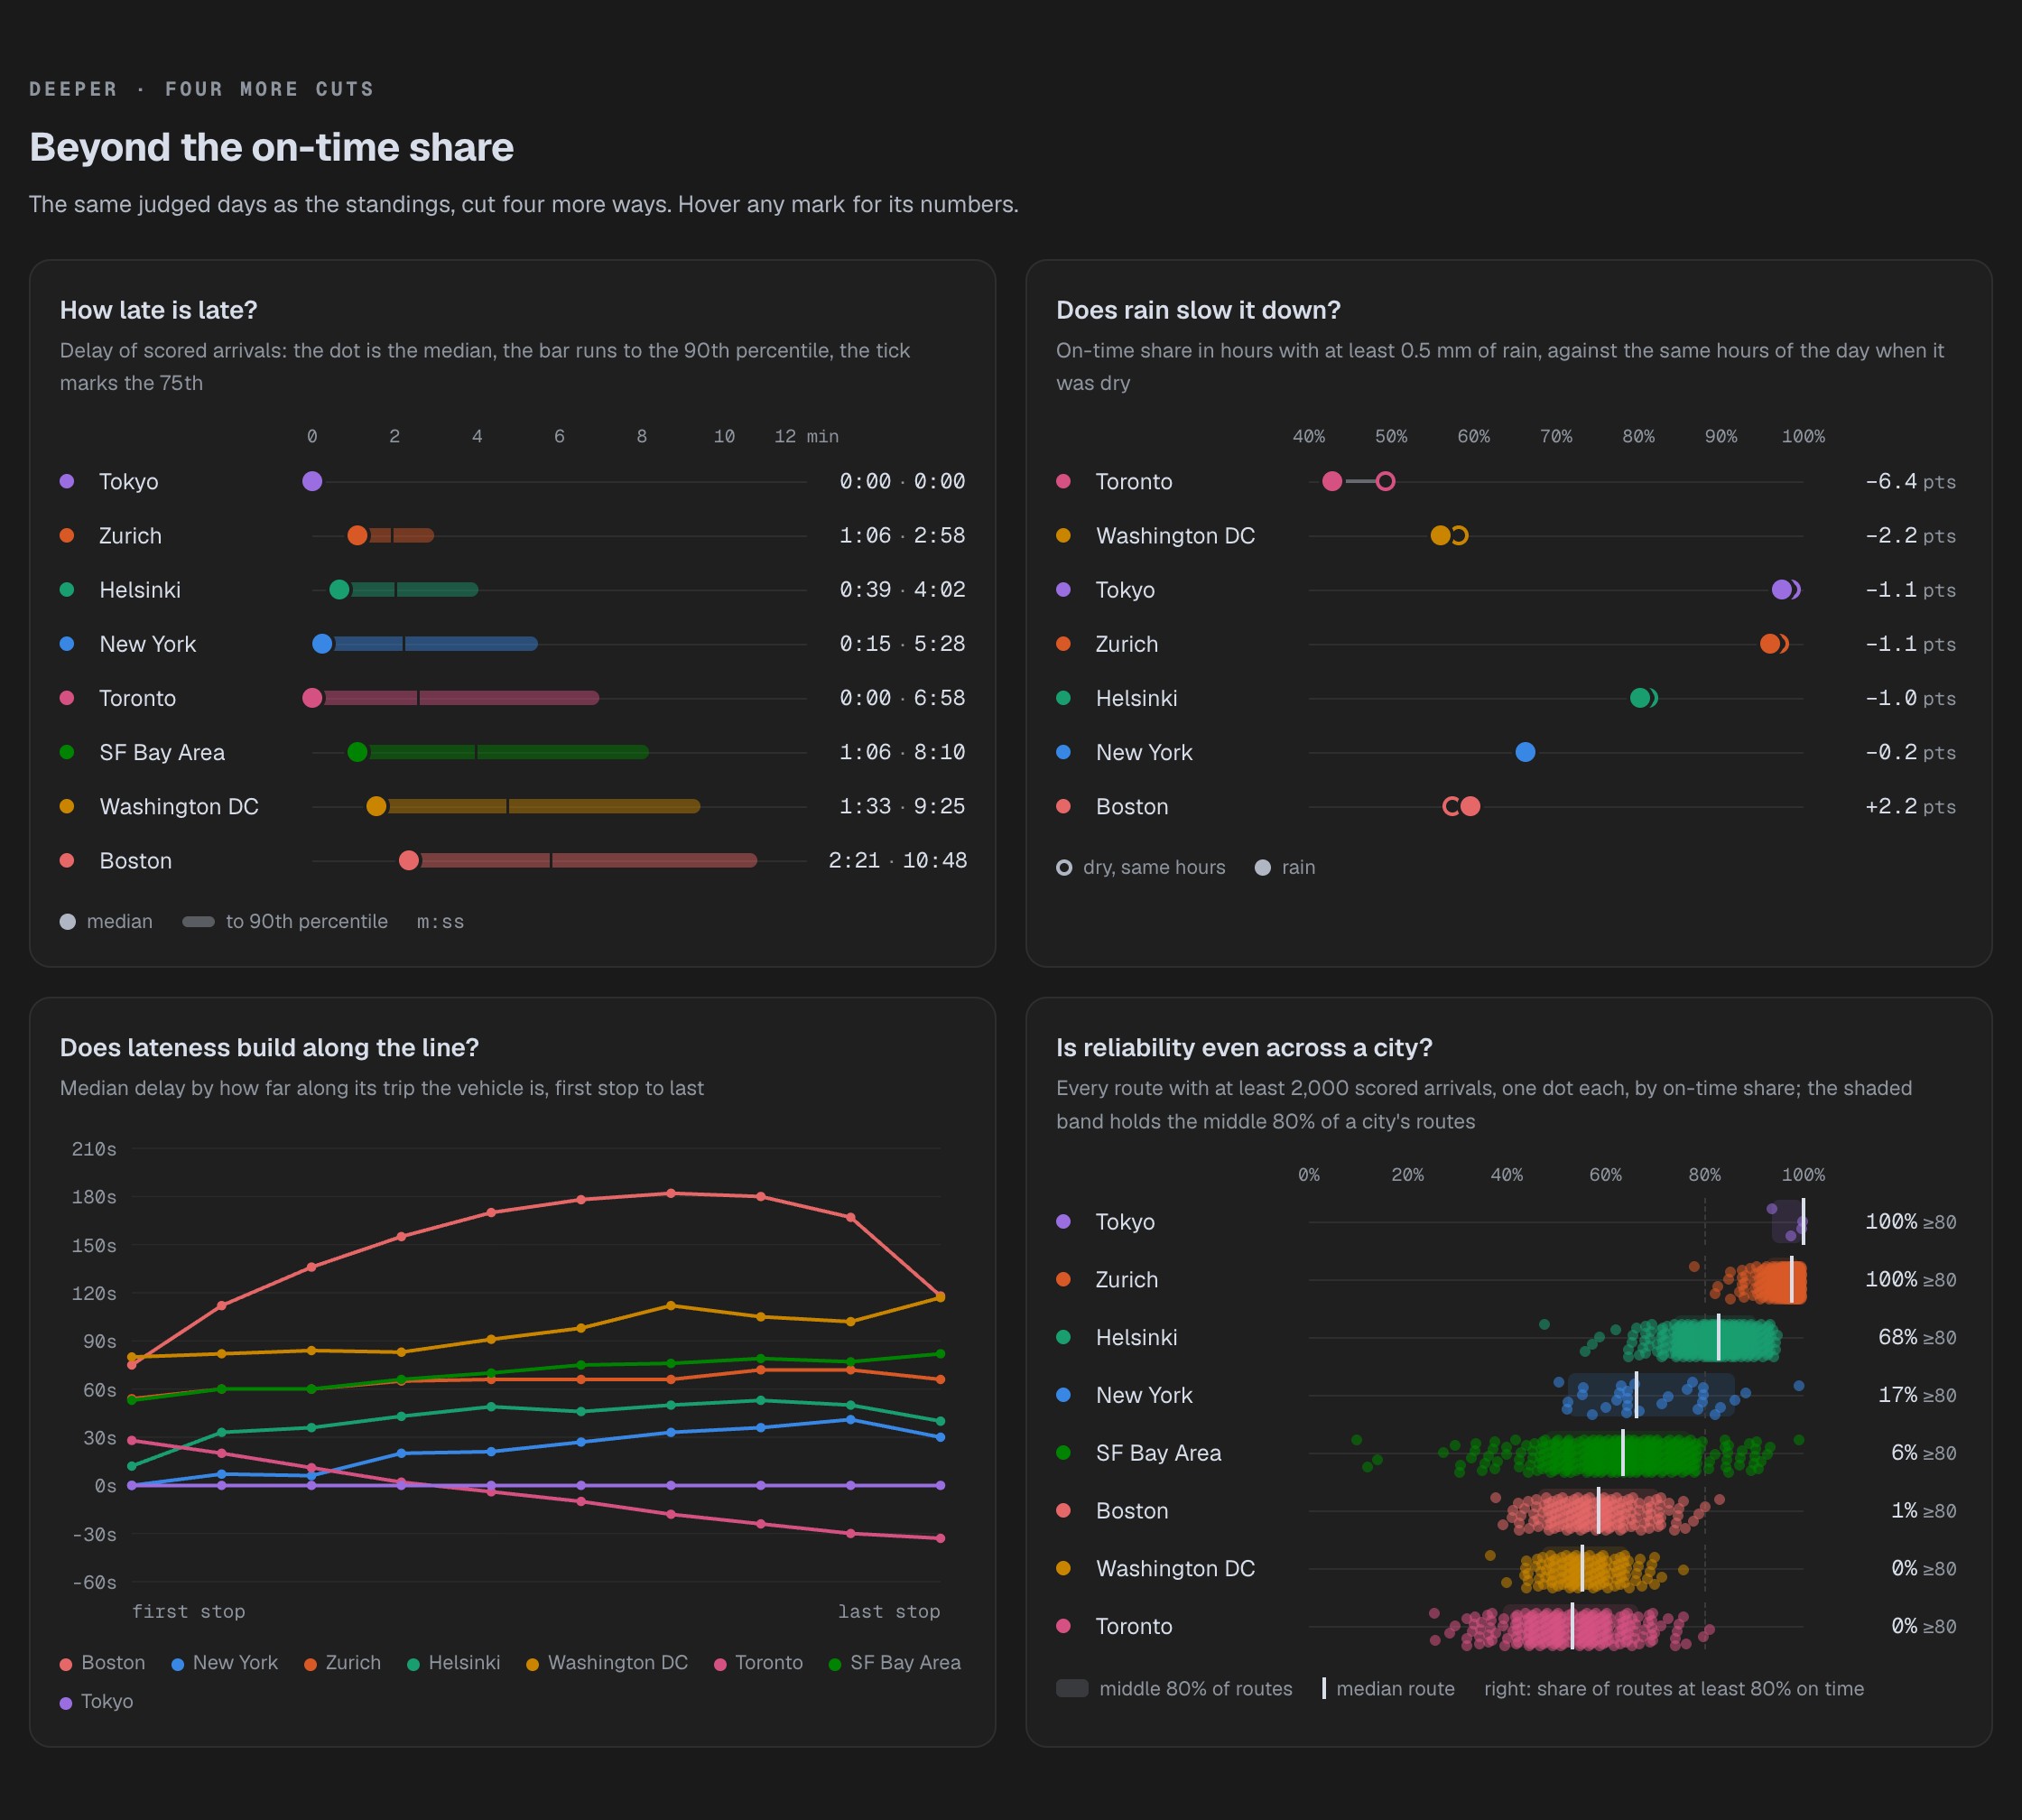
Four cuts at what the headline number hides.
- Median against p90 separates typical from bad: Tokyo 0:00 and 0:00, Boston 2:21 and 10:48. A median near zero can sit under a ten-minute tail.
- Rain against the same hours dry, at 0.5 mm/h or more: Toronto loses 6.4 points, Washington DC 2.2, New York 0.2 — and Boston gains 2.2.
- Delay along the trip runs both directions: Boston builds from 75 seconds at the first stop to about 182, while Toronto finishes 33 seconds early.
- Across 1,685 plotted routes, the share at 80% on time or better is 100% in Tokyo and Zurich, 17% in New York, and 0% in Washington DC and Toronto.
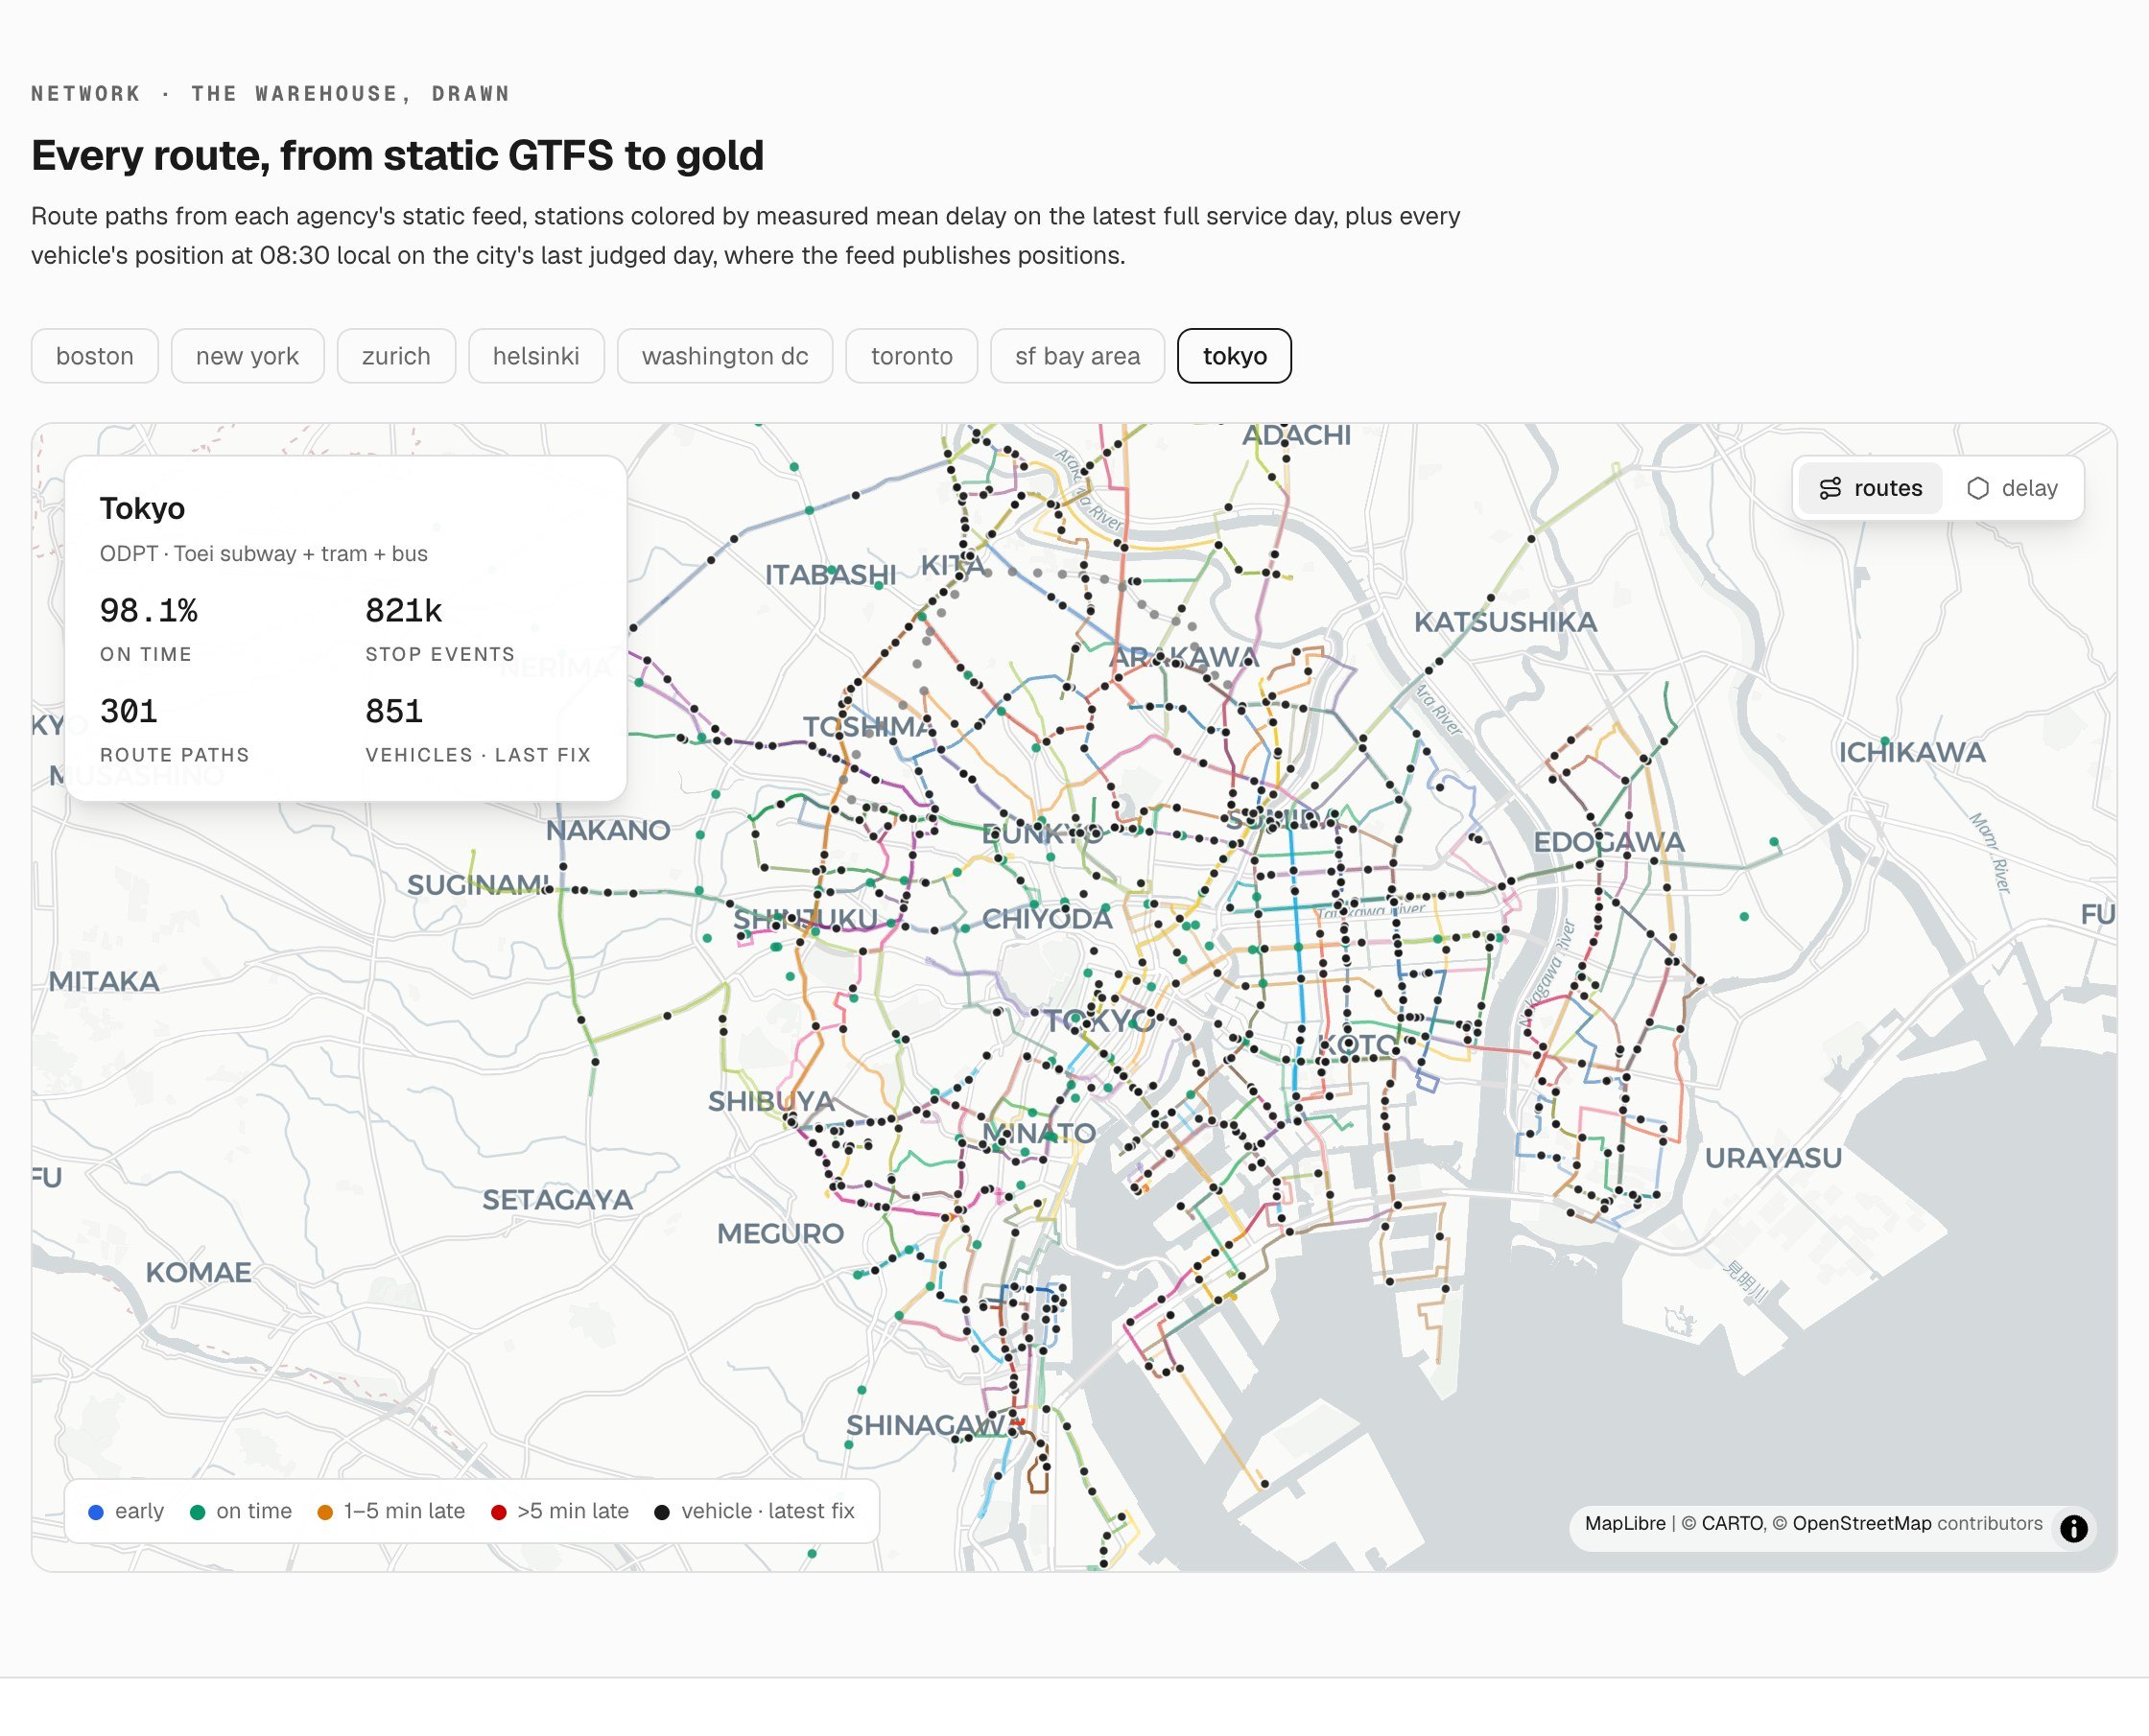
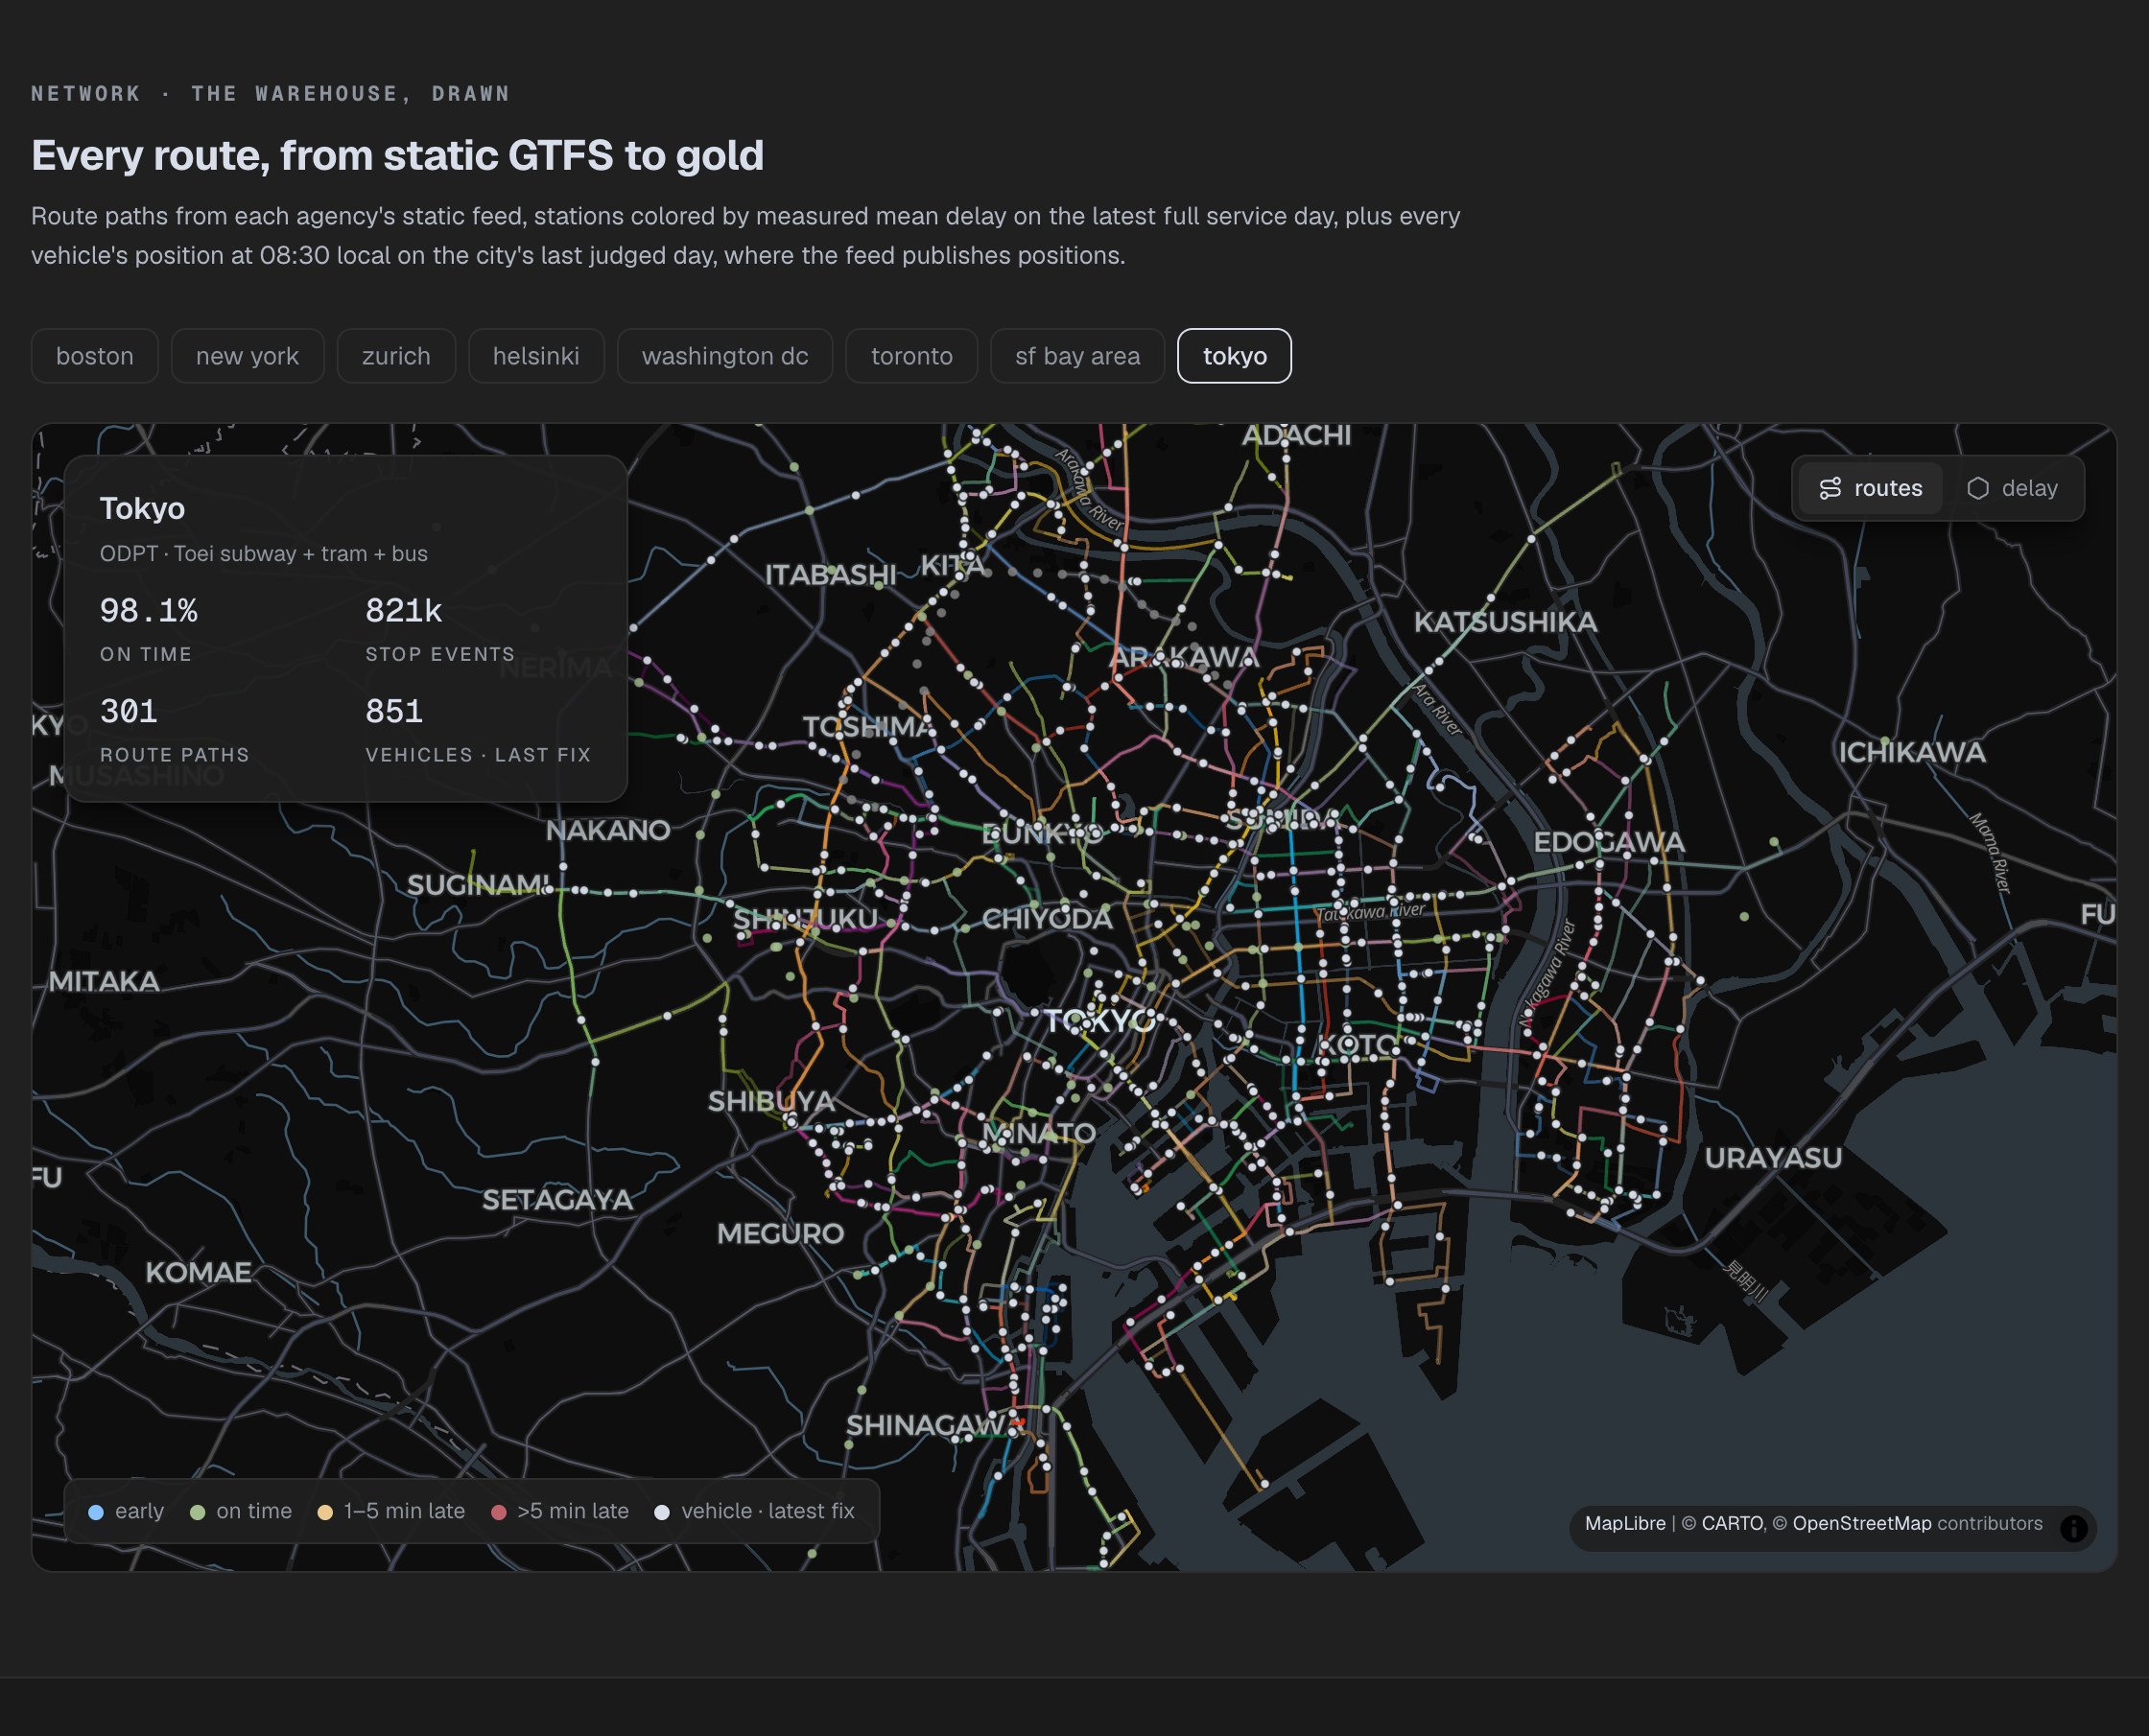
Tokyo, reconstructed from a feed with no arrival times.
- 98.1% on time over 821,000 scored stop events across 301 route paths, with 851 vehicles placed at 08:30 local on its last judged day.
- ODPT publishes an operator-stated delay and no arrival time for trains, so every arrival drawn here was detected from station-to-station transitions across snapshots.
- Tokyo was the last city retired, on 2026-09-25, once it banked its twentieth judged day.
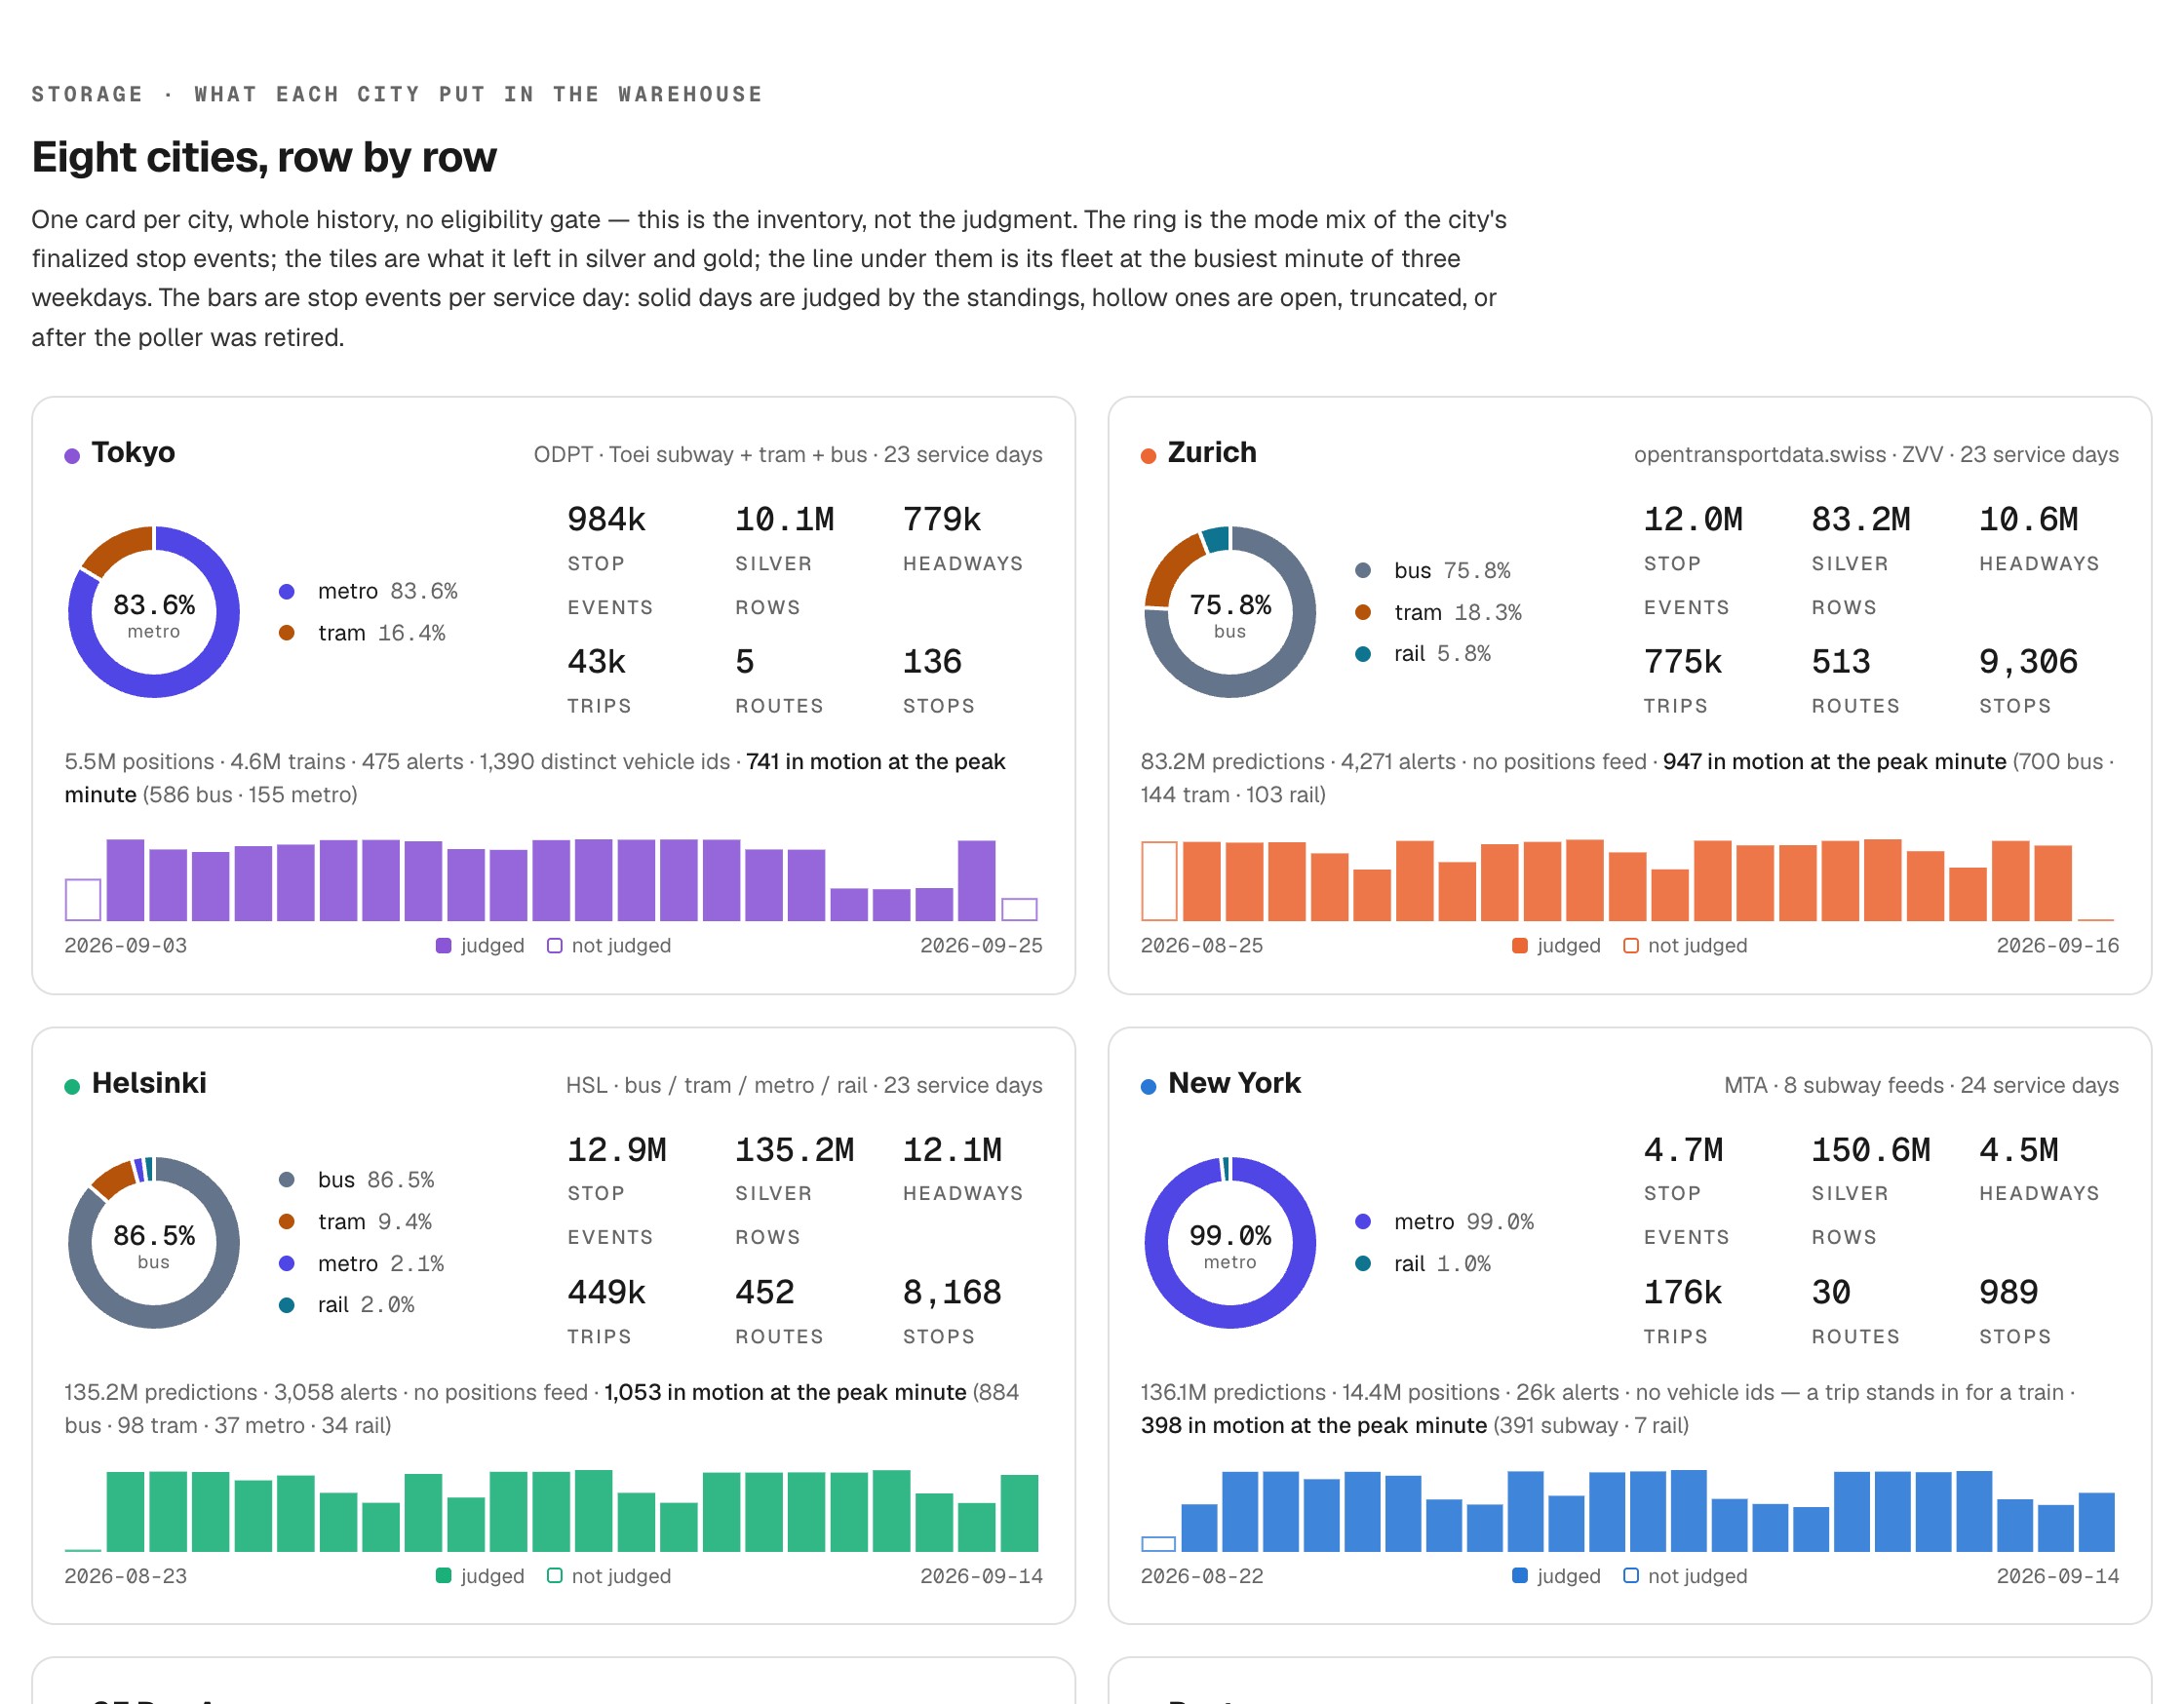
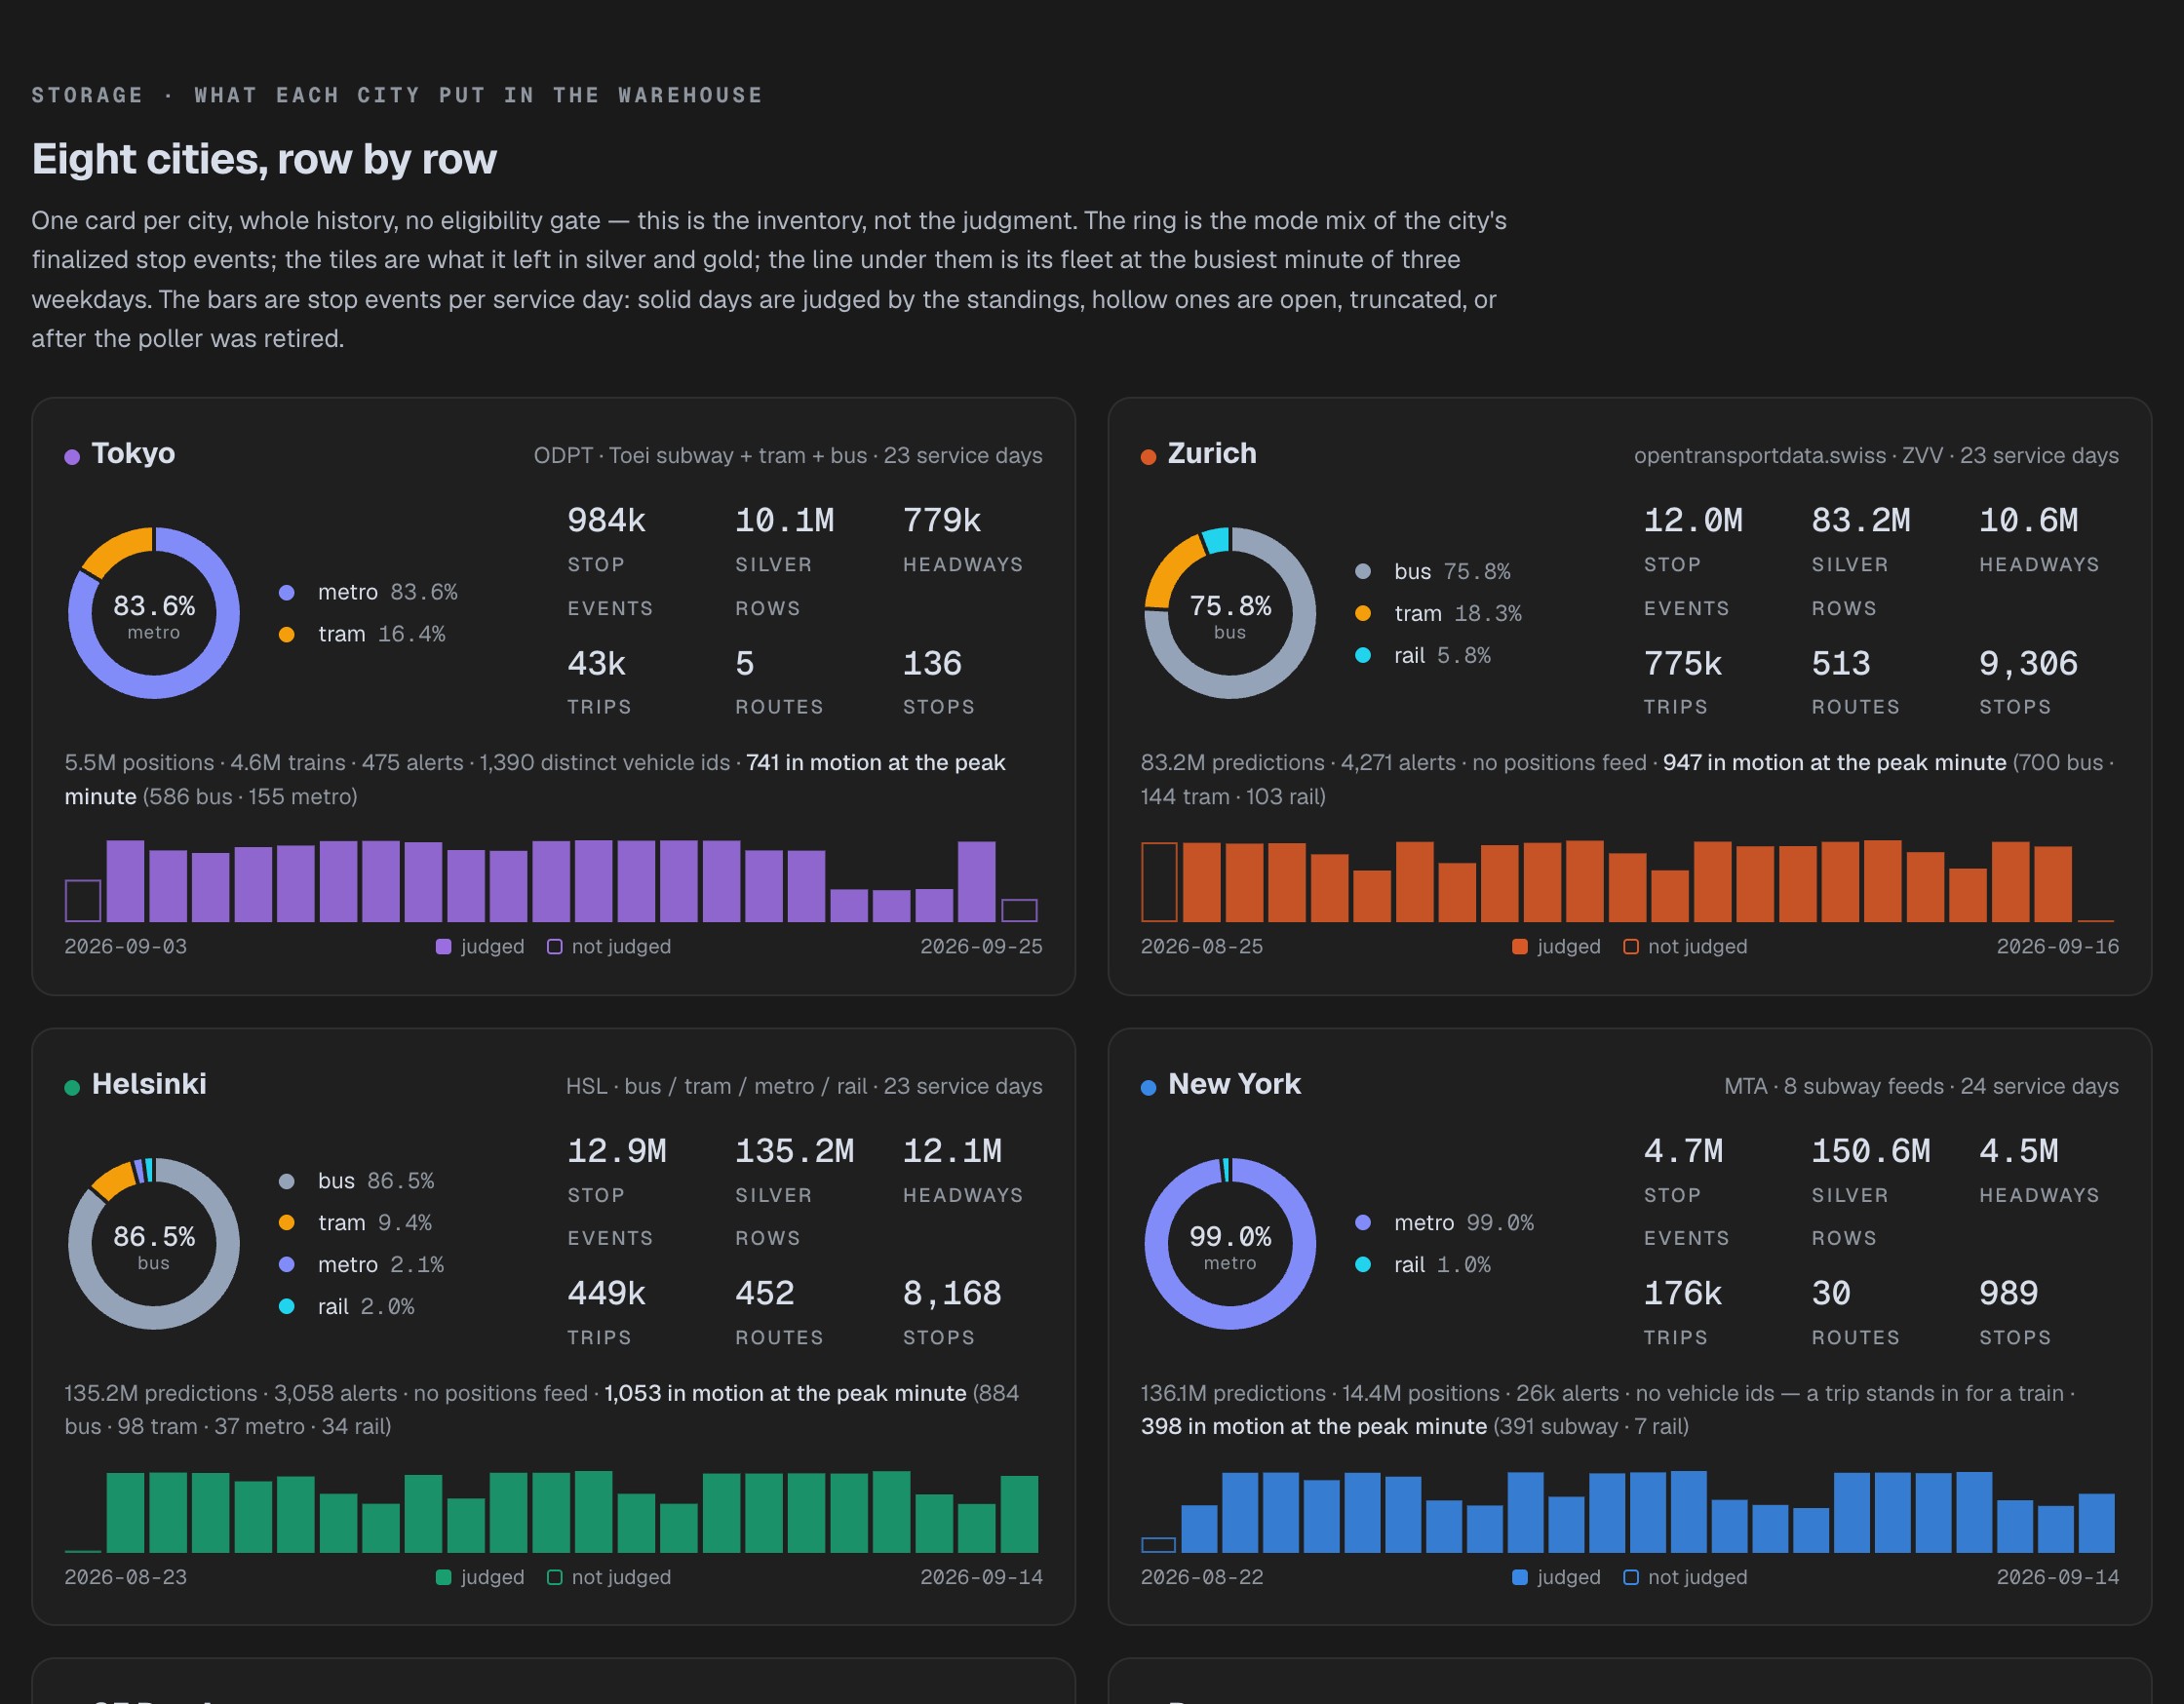
What each city actually put in the warehouse.
- Stop events against silver rows exposes the finalization ratio per city: New York's 4.7M stop events come out of 150.6M silver rows, Tokyo's 984k out of 10.1M.
- Zurich contributes 12.0M stop events and 10.6M headways off a feed cut from 5,122 national routes down to a 615-route city allow-list.
- Each card carries its own mode mix, fleet at the peak minute, and stop events per service day, so a city's totals can be read against how much service it runs.
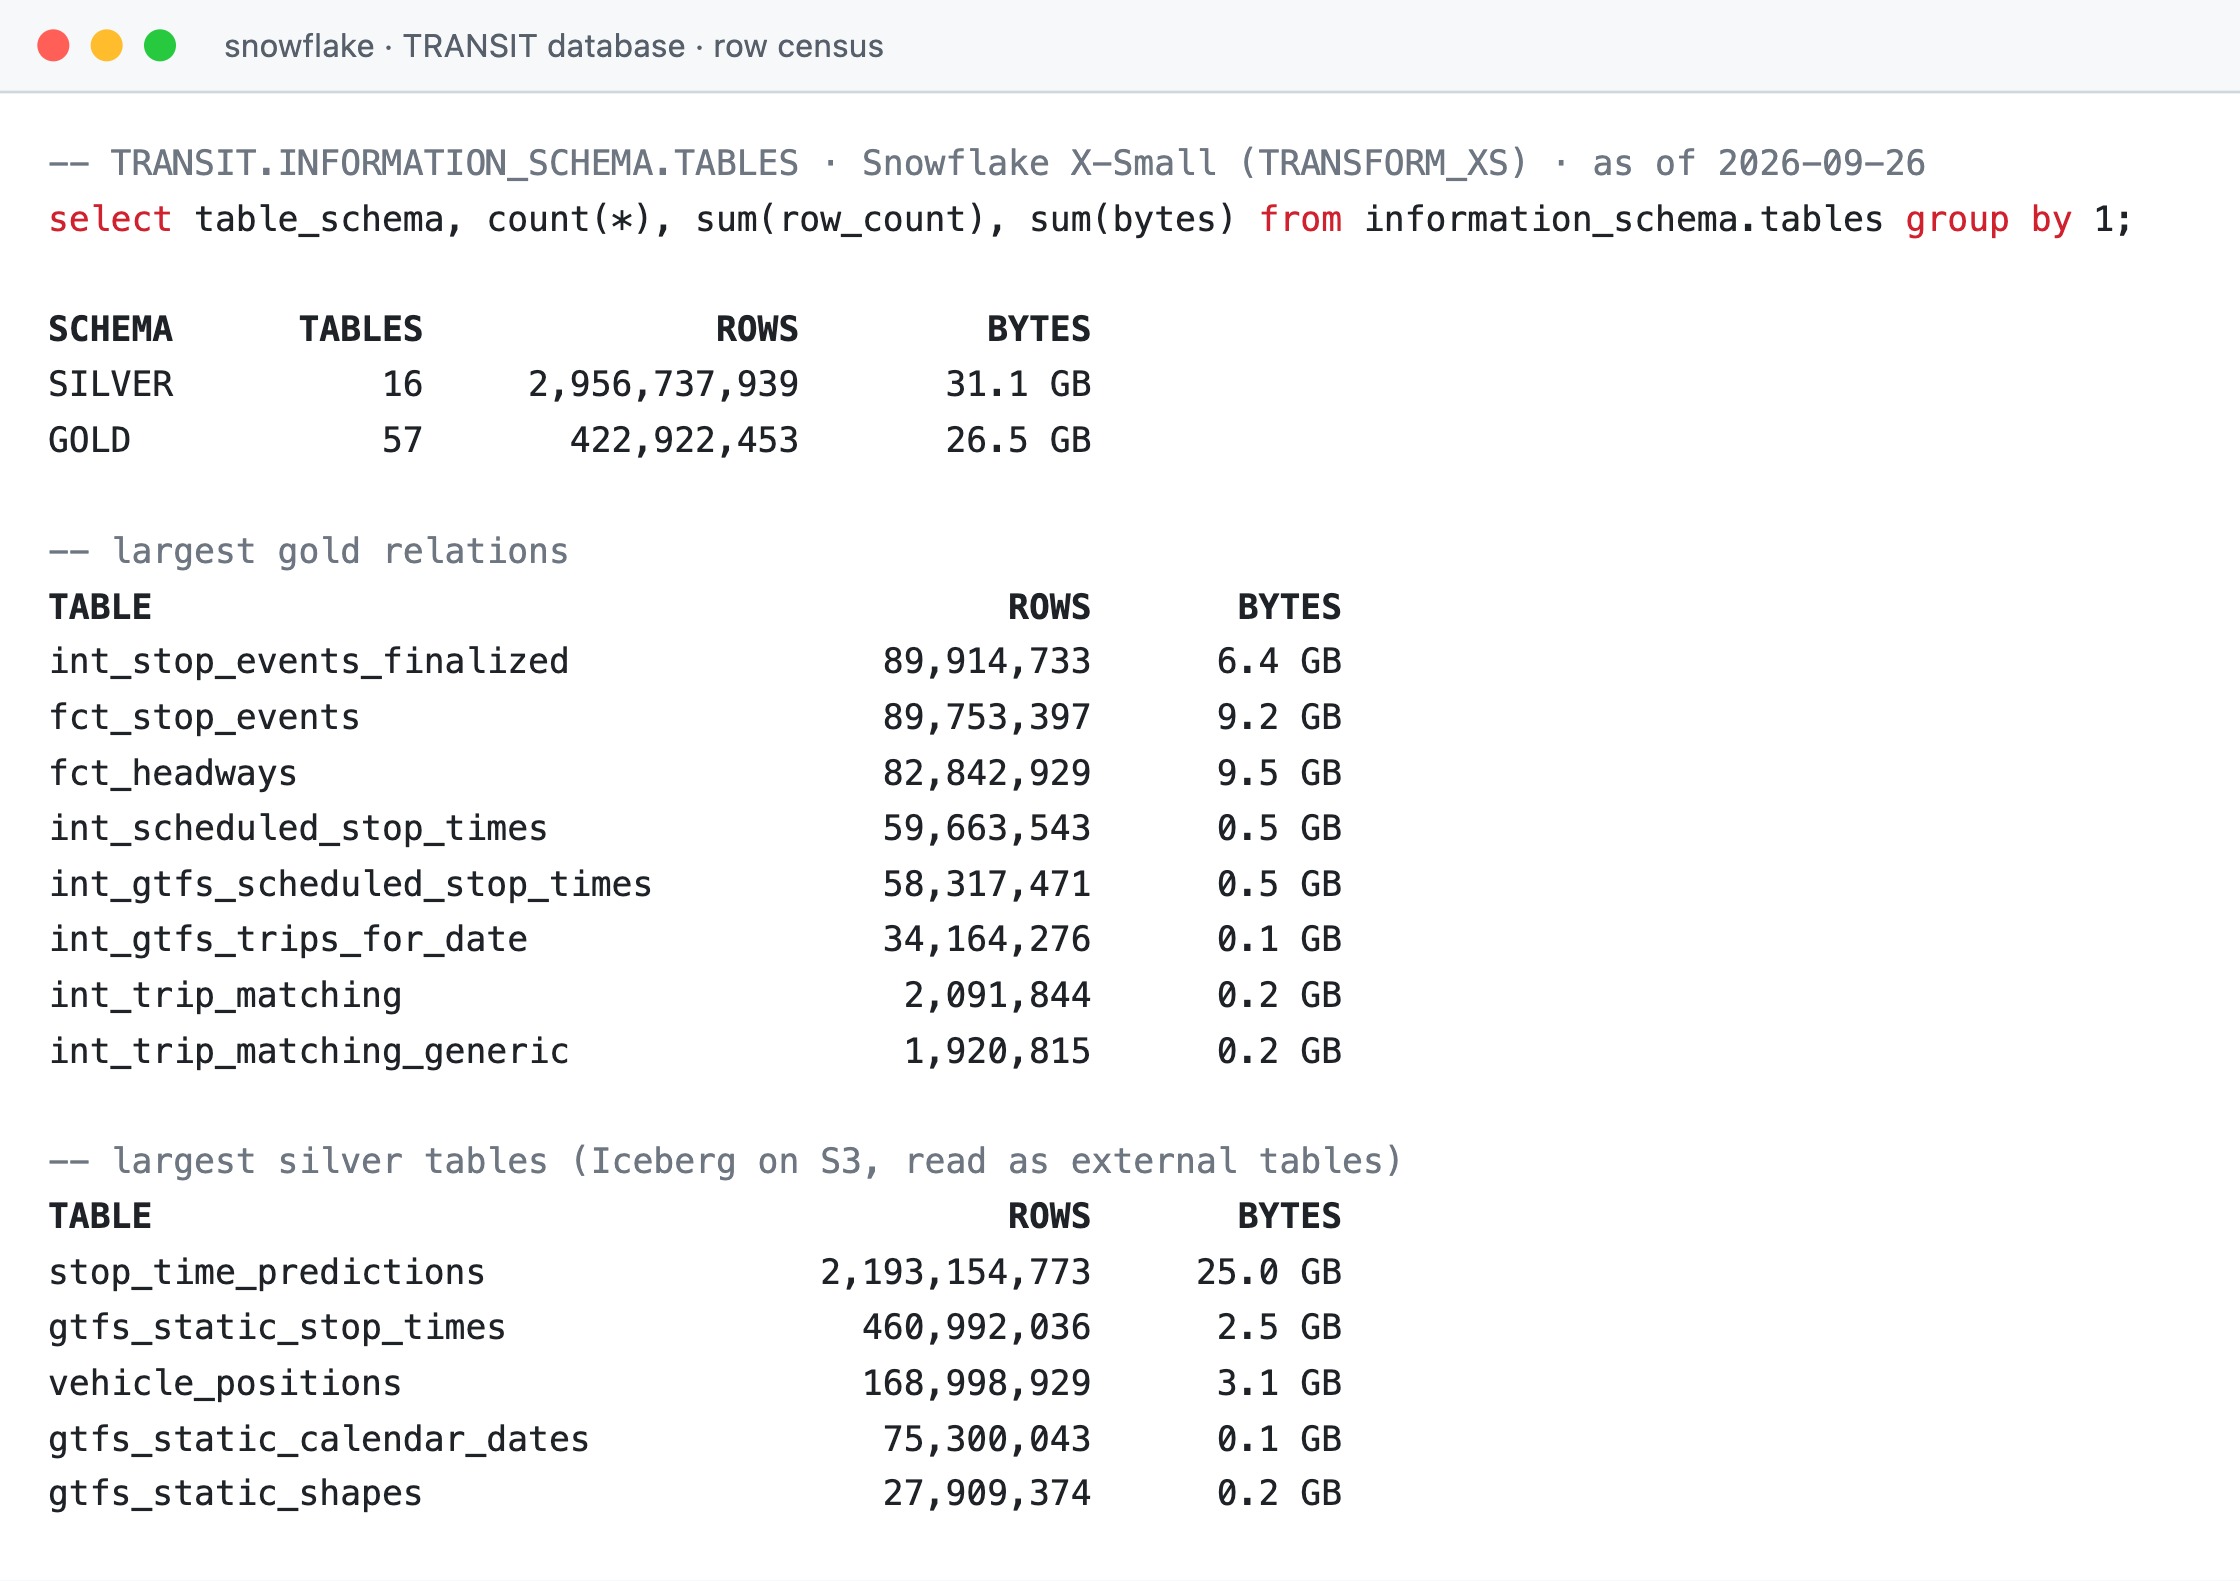
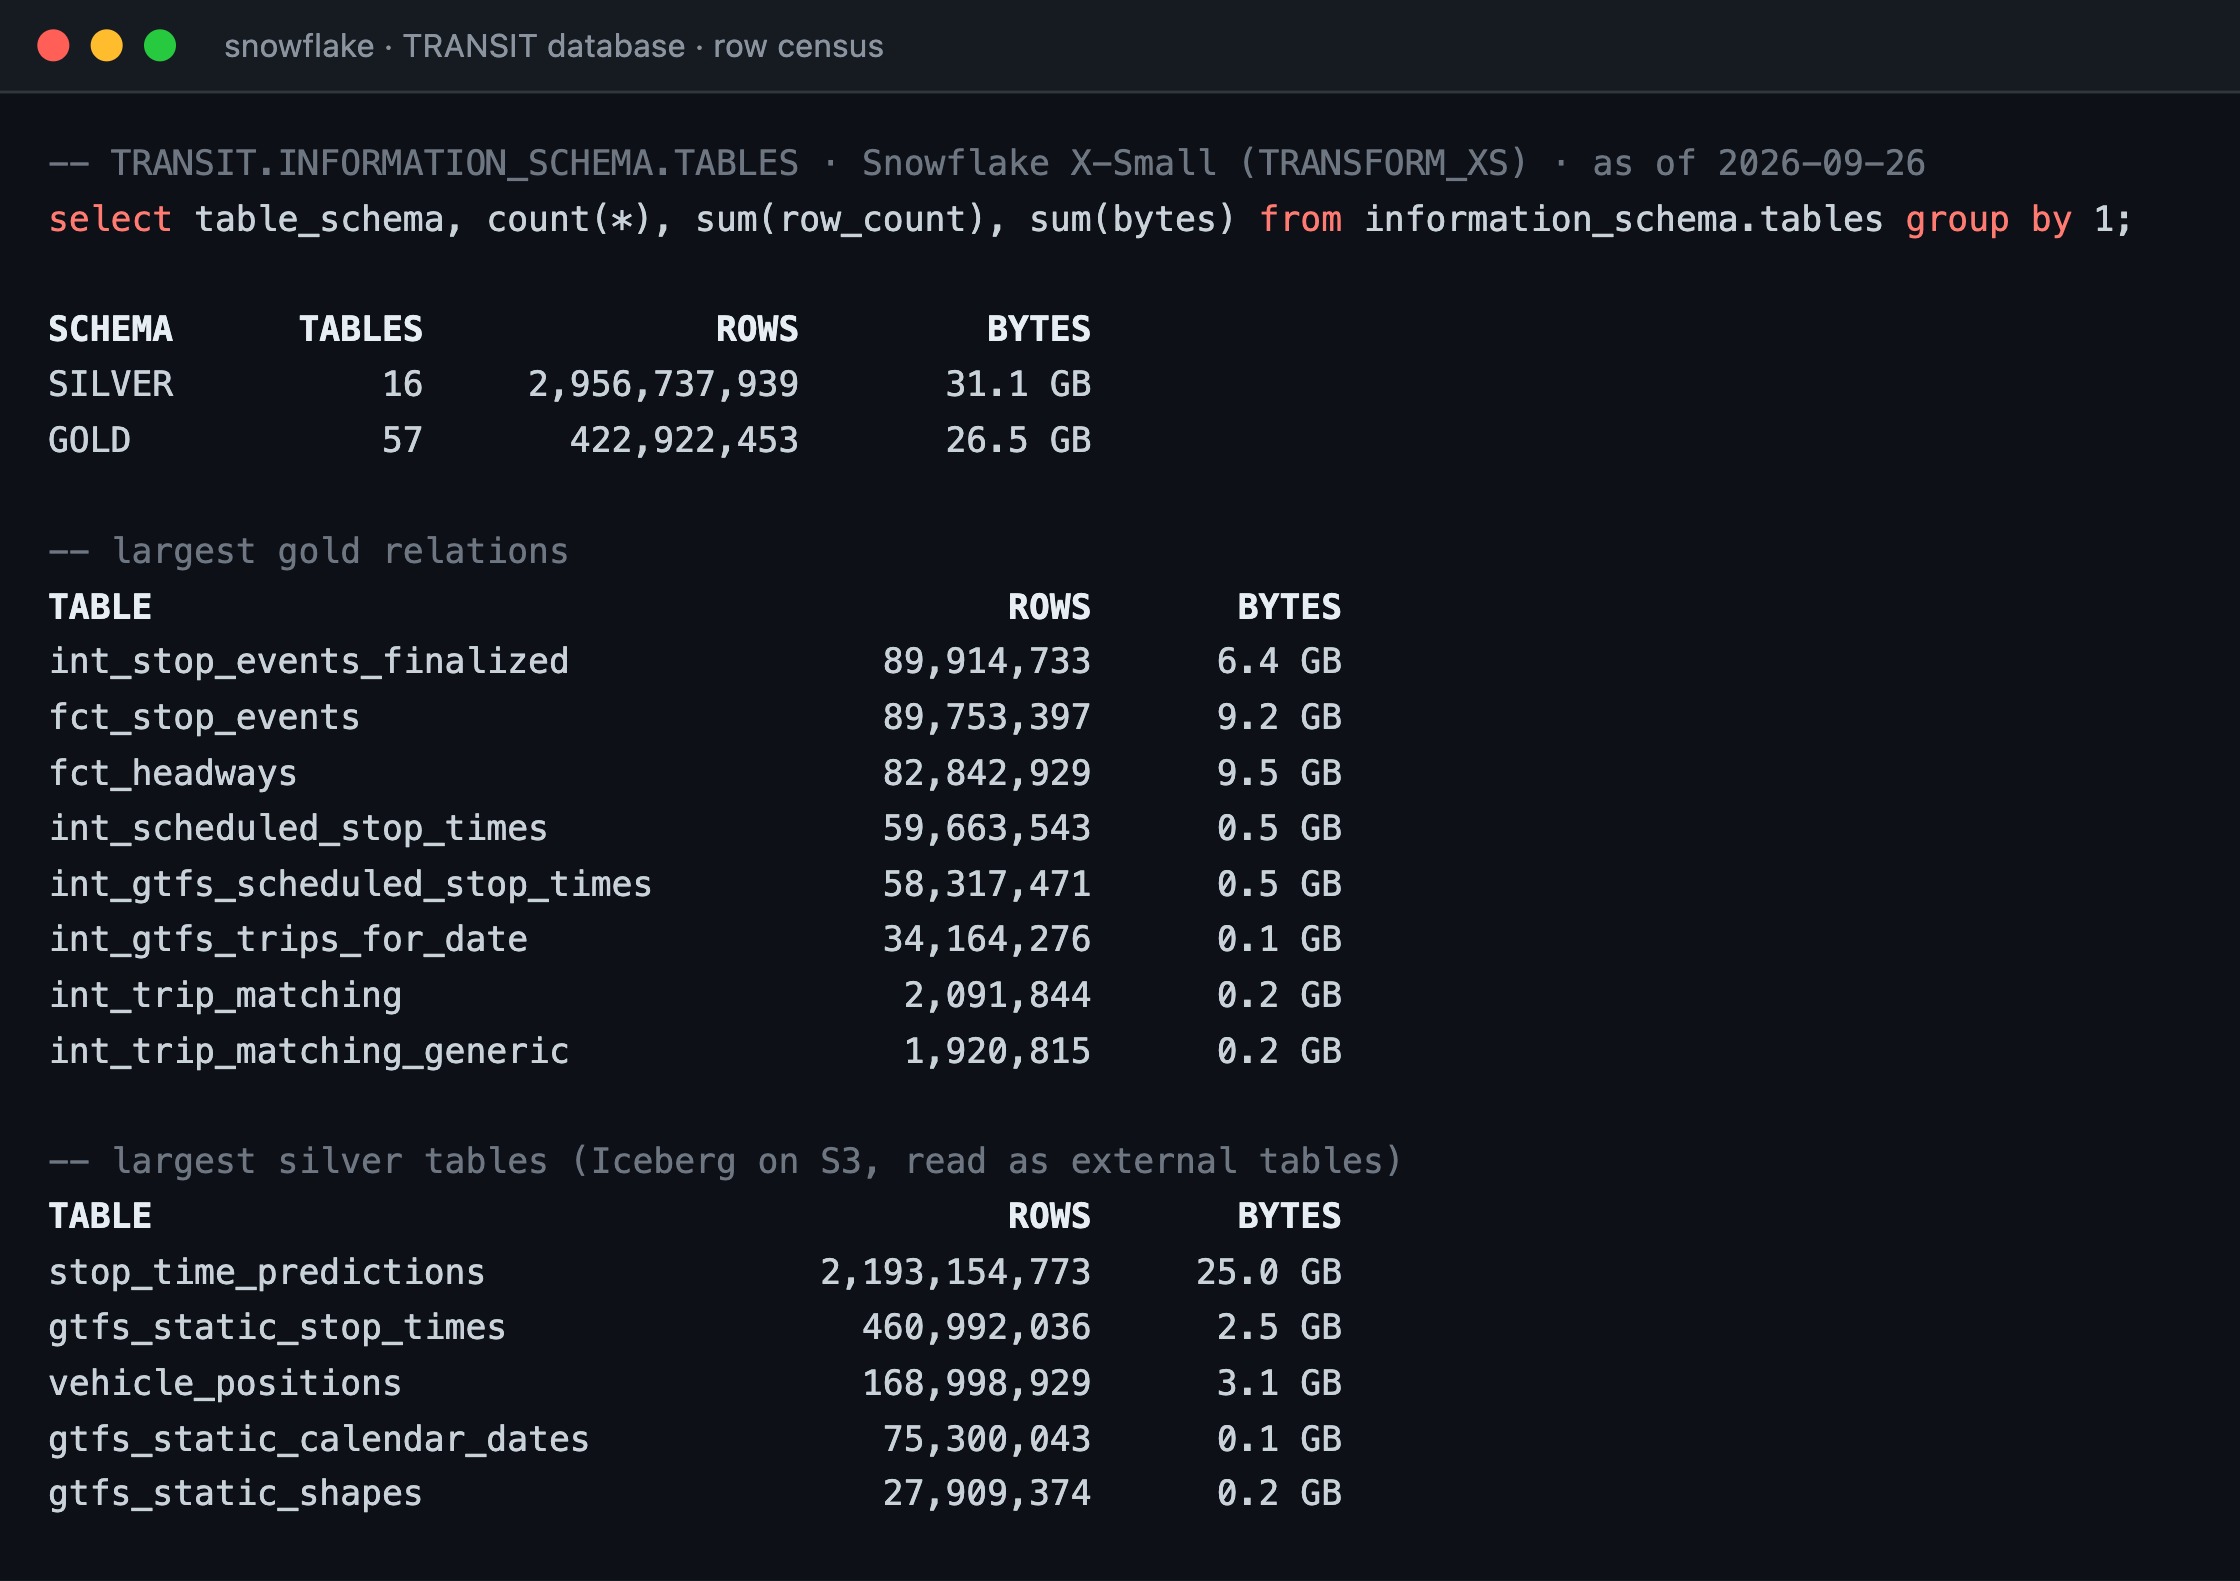
The warehouse census: 3.4 billion rows across two schemas.
- SILVER holds 16 tables and 2,956,737,939 rows in 31.1 GB; GOLD holds 57 relations and 422,922,453 rows in 26.5 GB.
- stop_time_predictions is the 2.19 billion-row table every arrival has to be selected out of, the restated predictions as they landed and before finalization.
- The largest gold tables are int_stop_events_finalized at 89.9M, fct_stop_events at 89.8M, and fct_headways at 82.8M, the three that carry per-stop measurement.
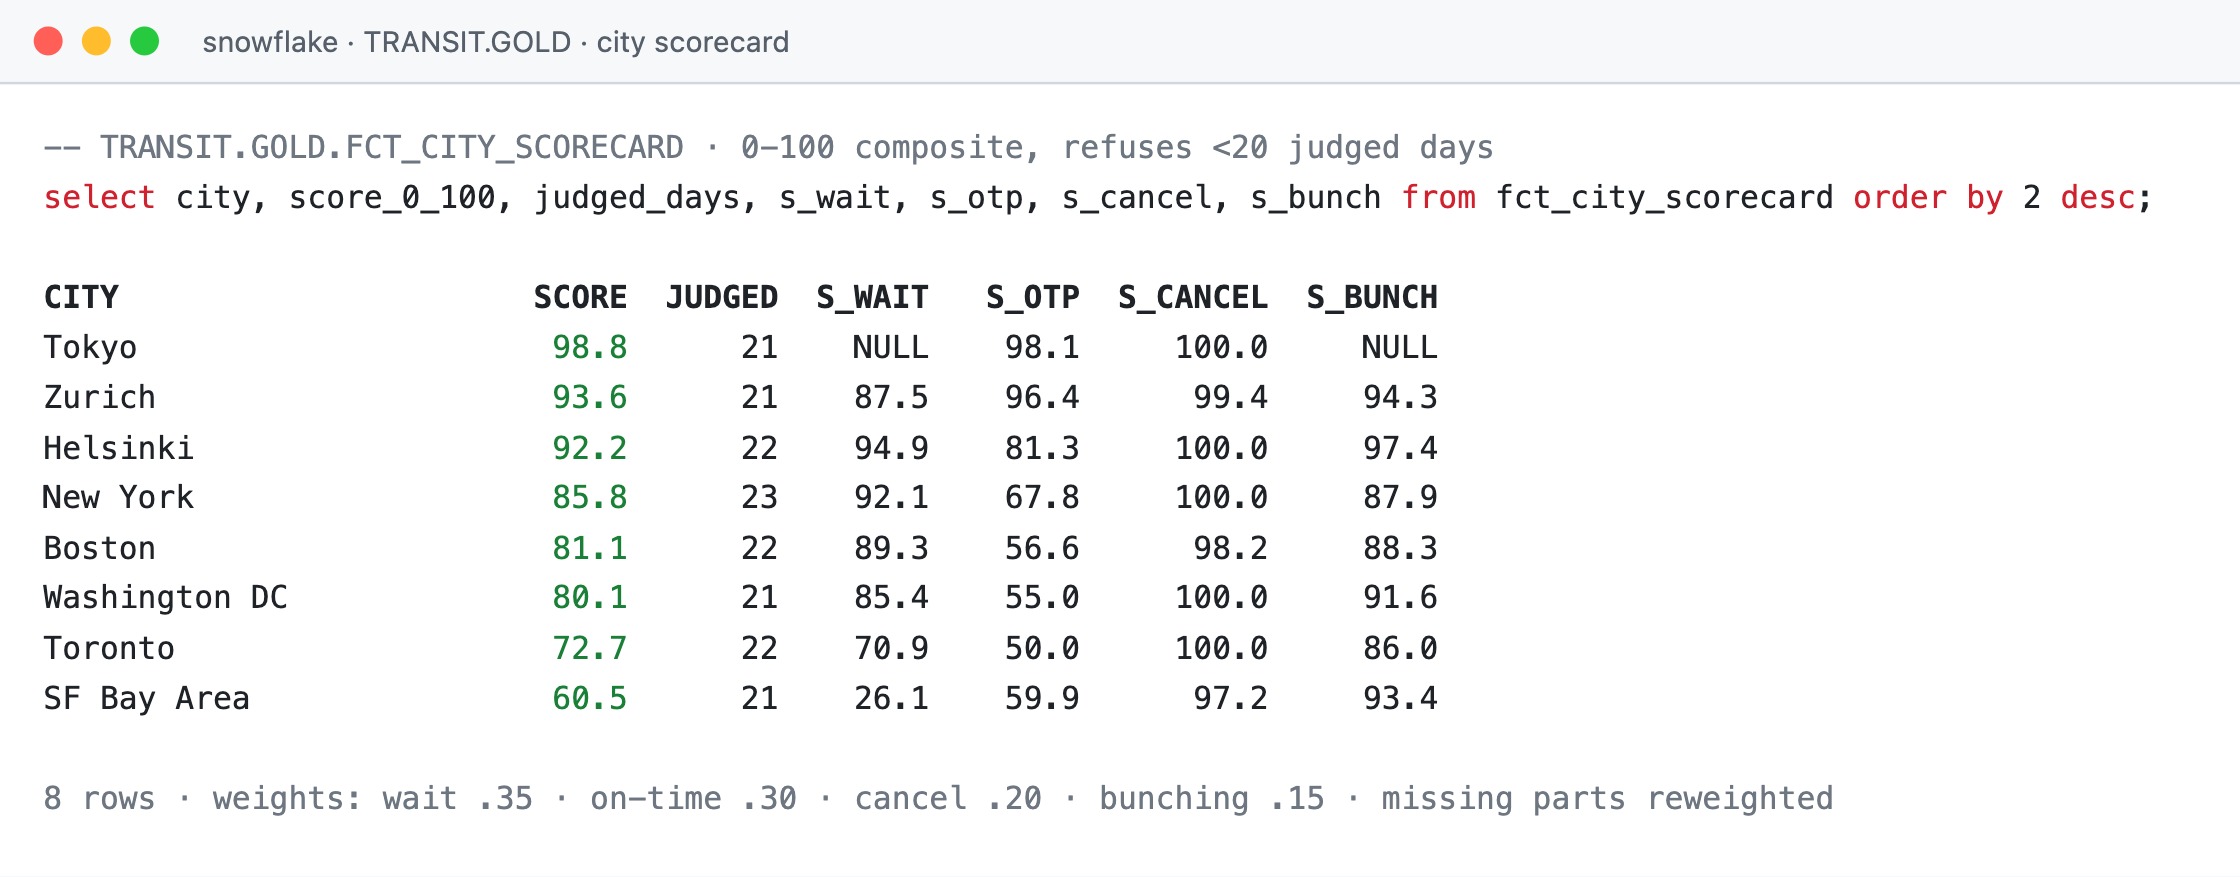
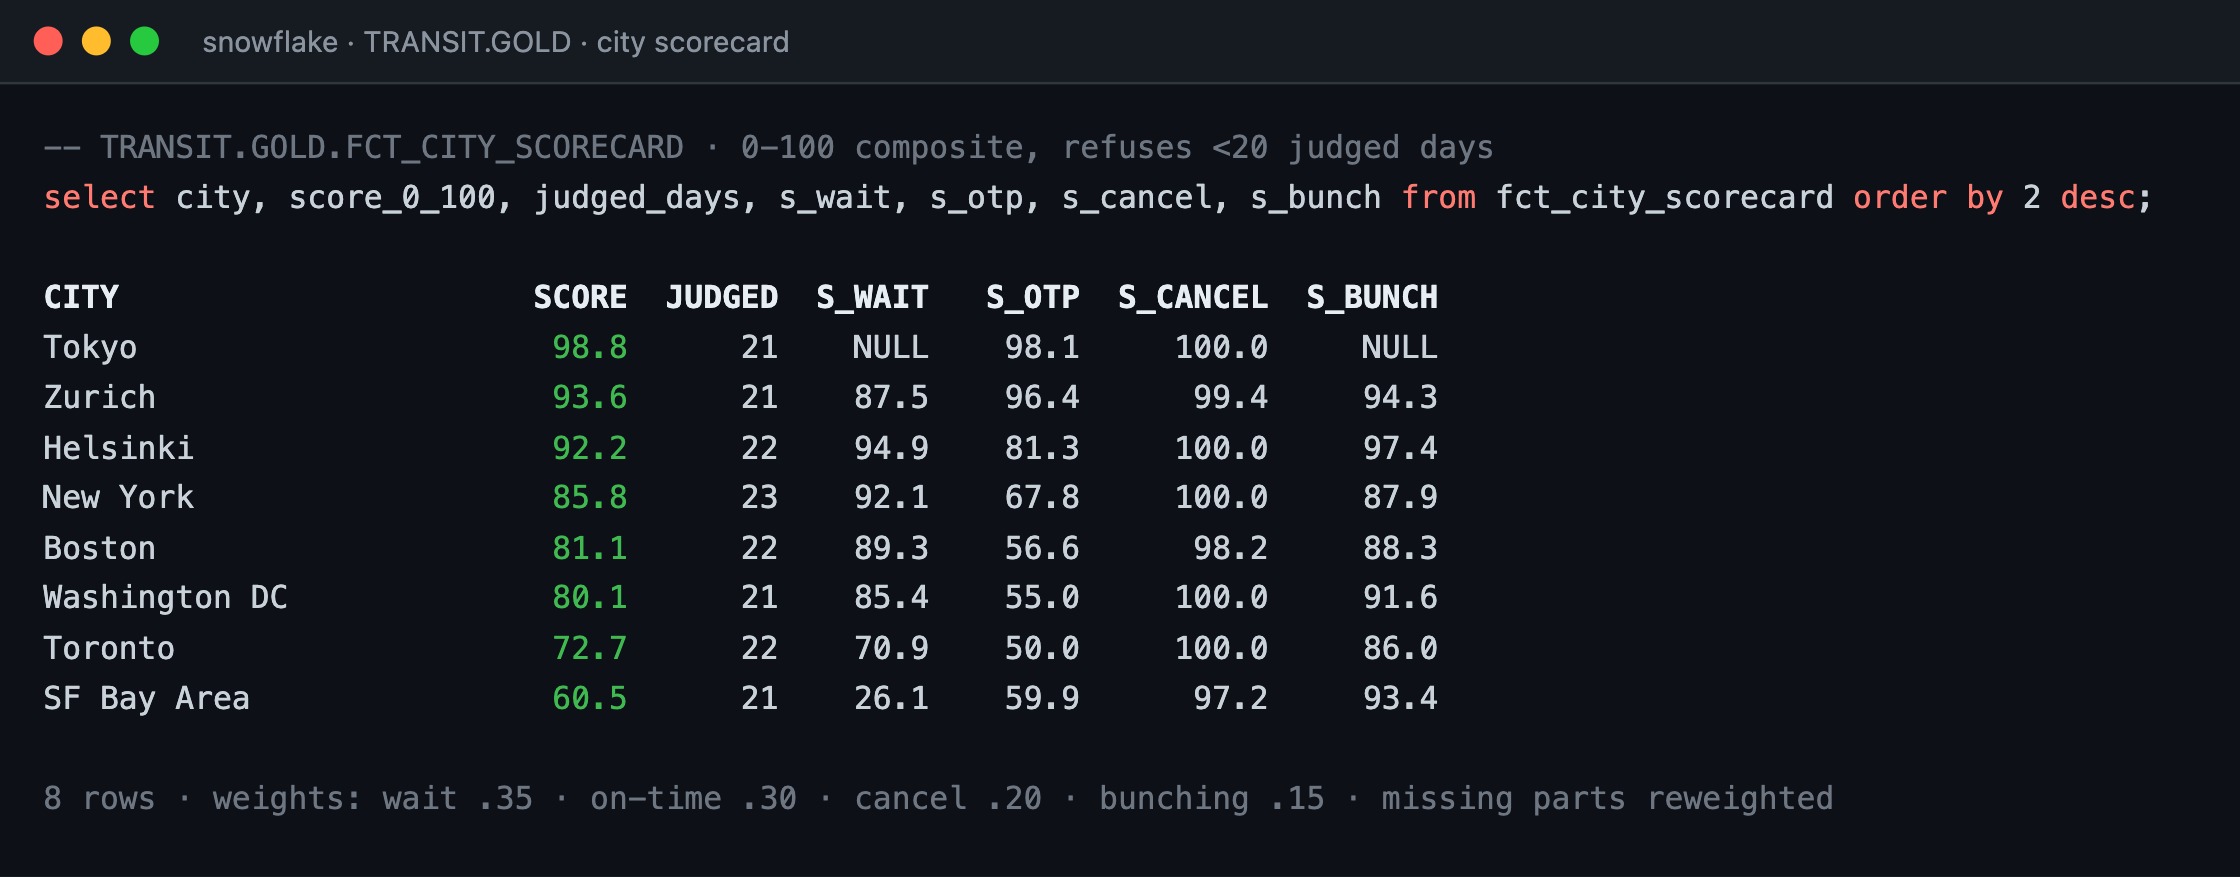
Eight rows, where the whole pipeline ends.
- fct_city_scorecard carries one row per city: the composite score, the judged-day count, and the four sub-scores it is built from.
- Zurich's 93.6 decomposes to 87.5 on wait, 96.4 on on-time, 99.4 on cancellations, and 94.3 on bunching, weighted 35/30/20/15.
- 2.96 billion silver rows reduce to this table, and every number the public standings render comes out of these eight rows.
50 models, 242 tests, zero errors.
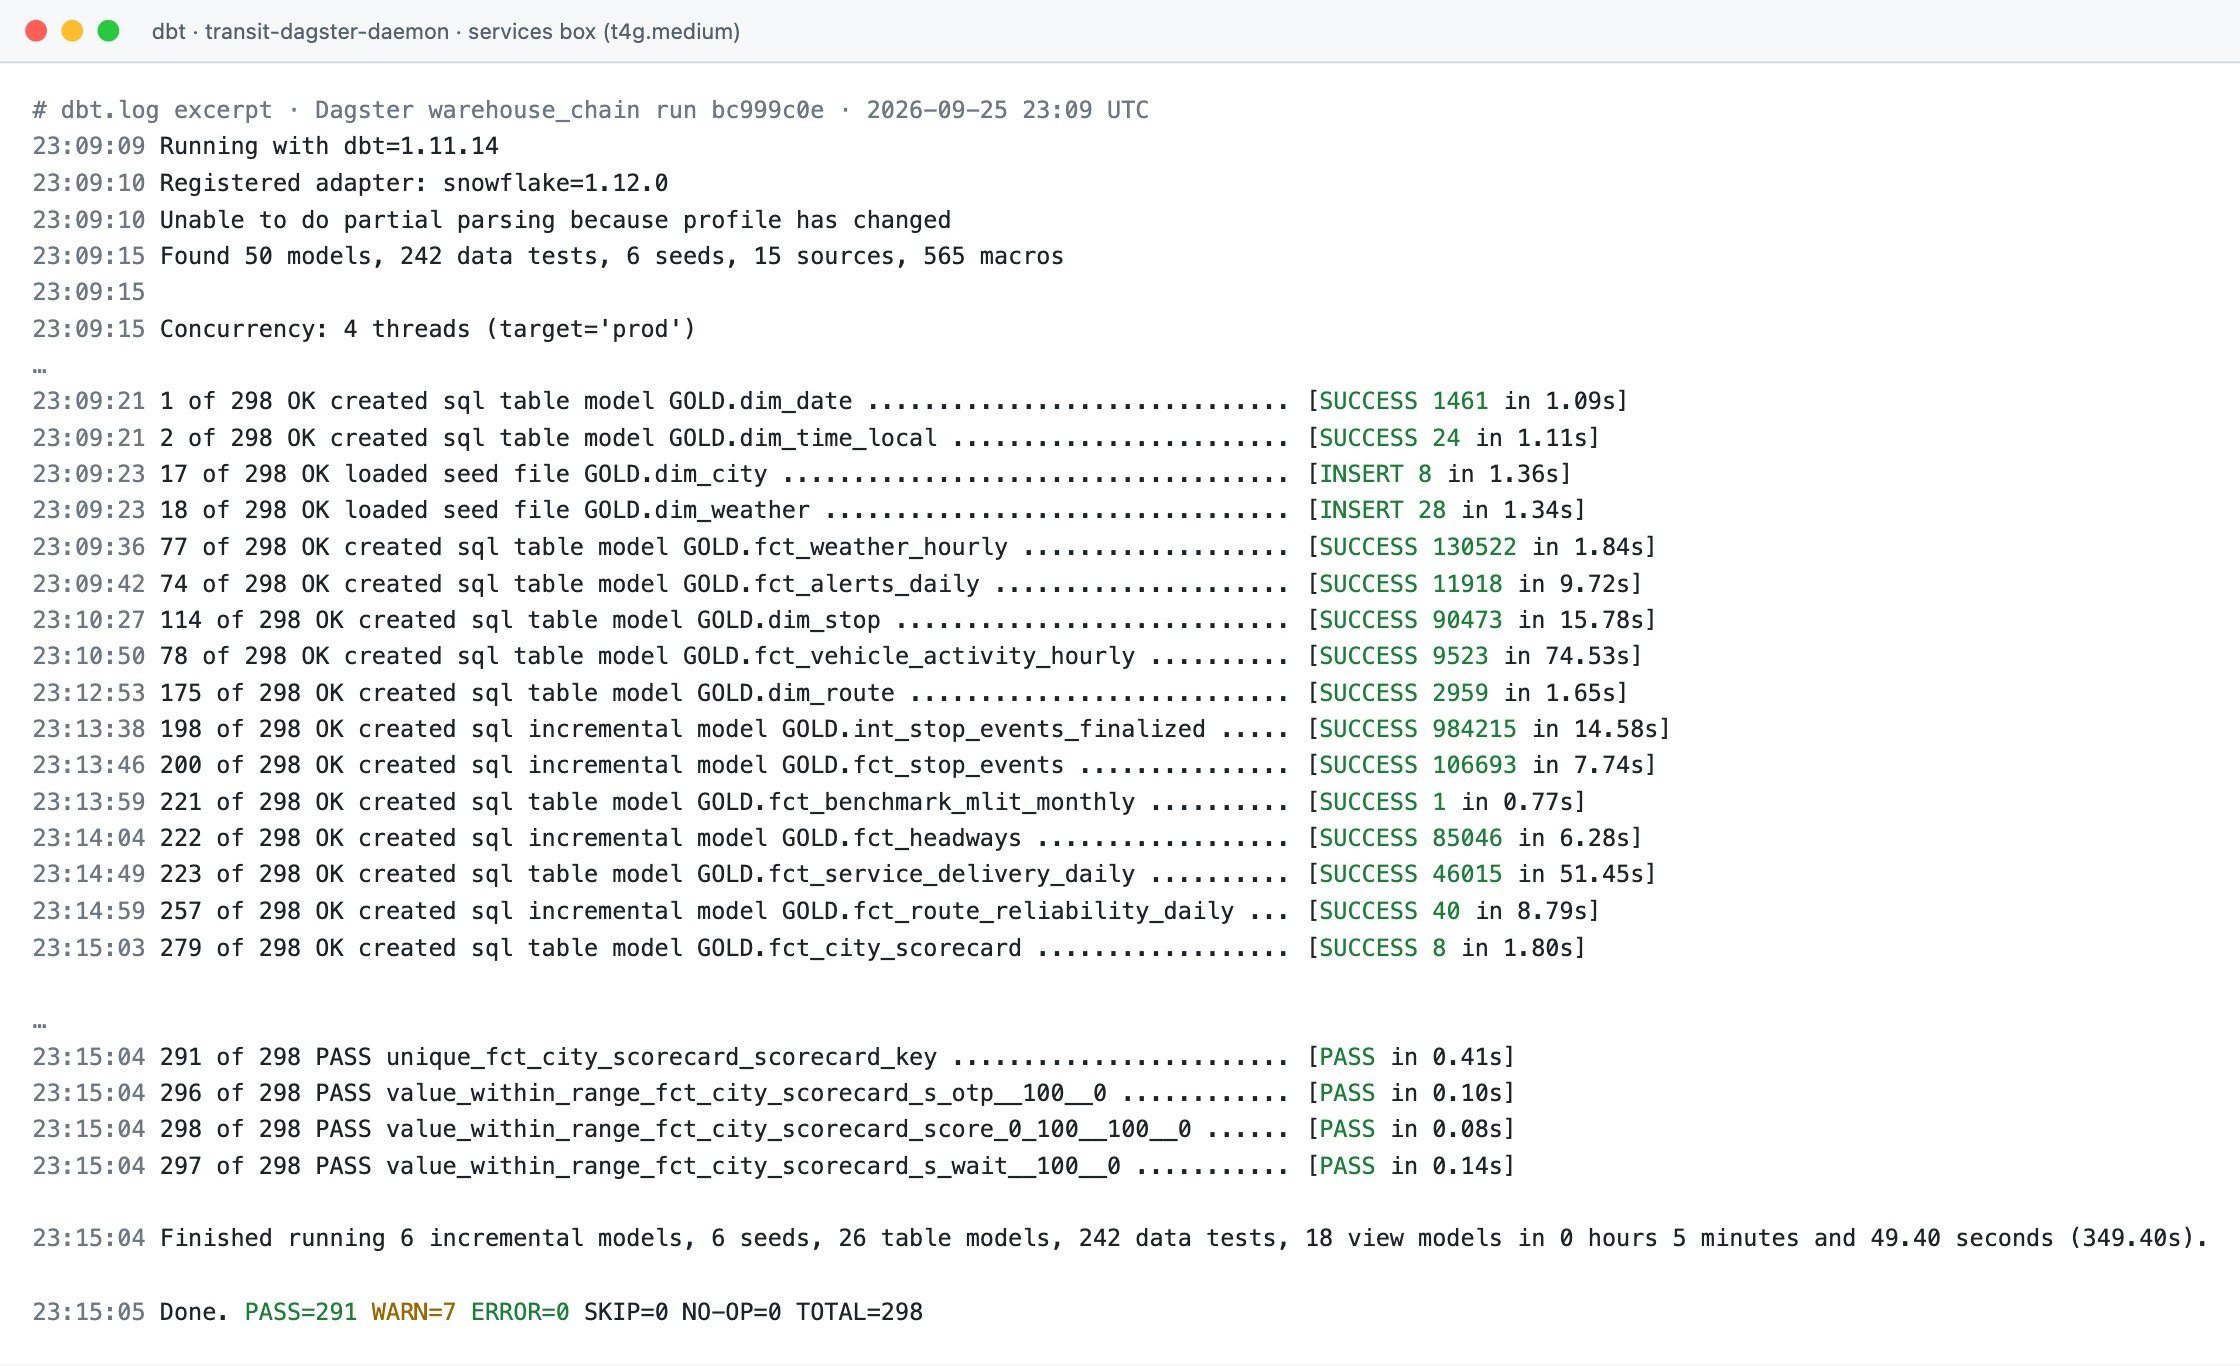
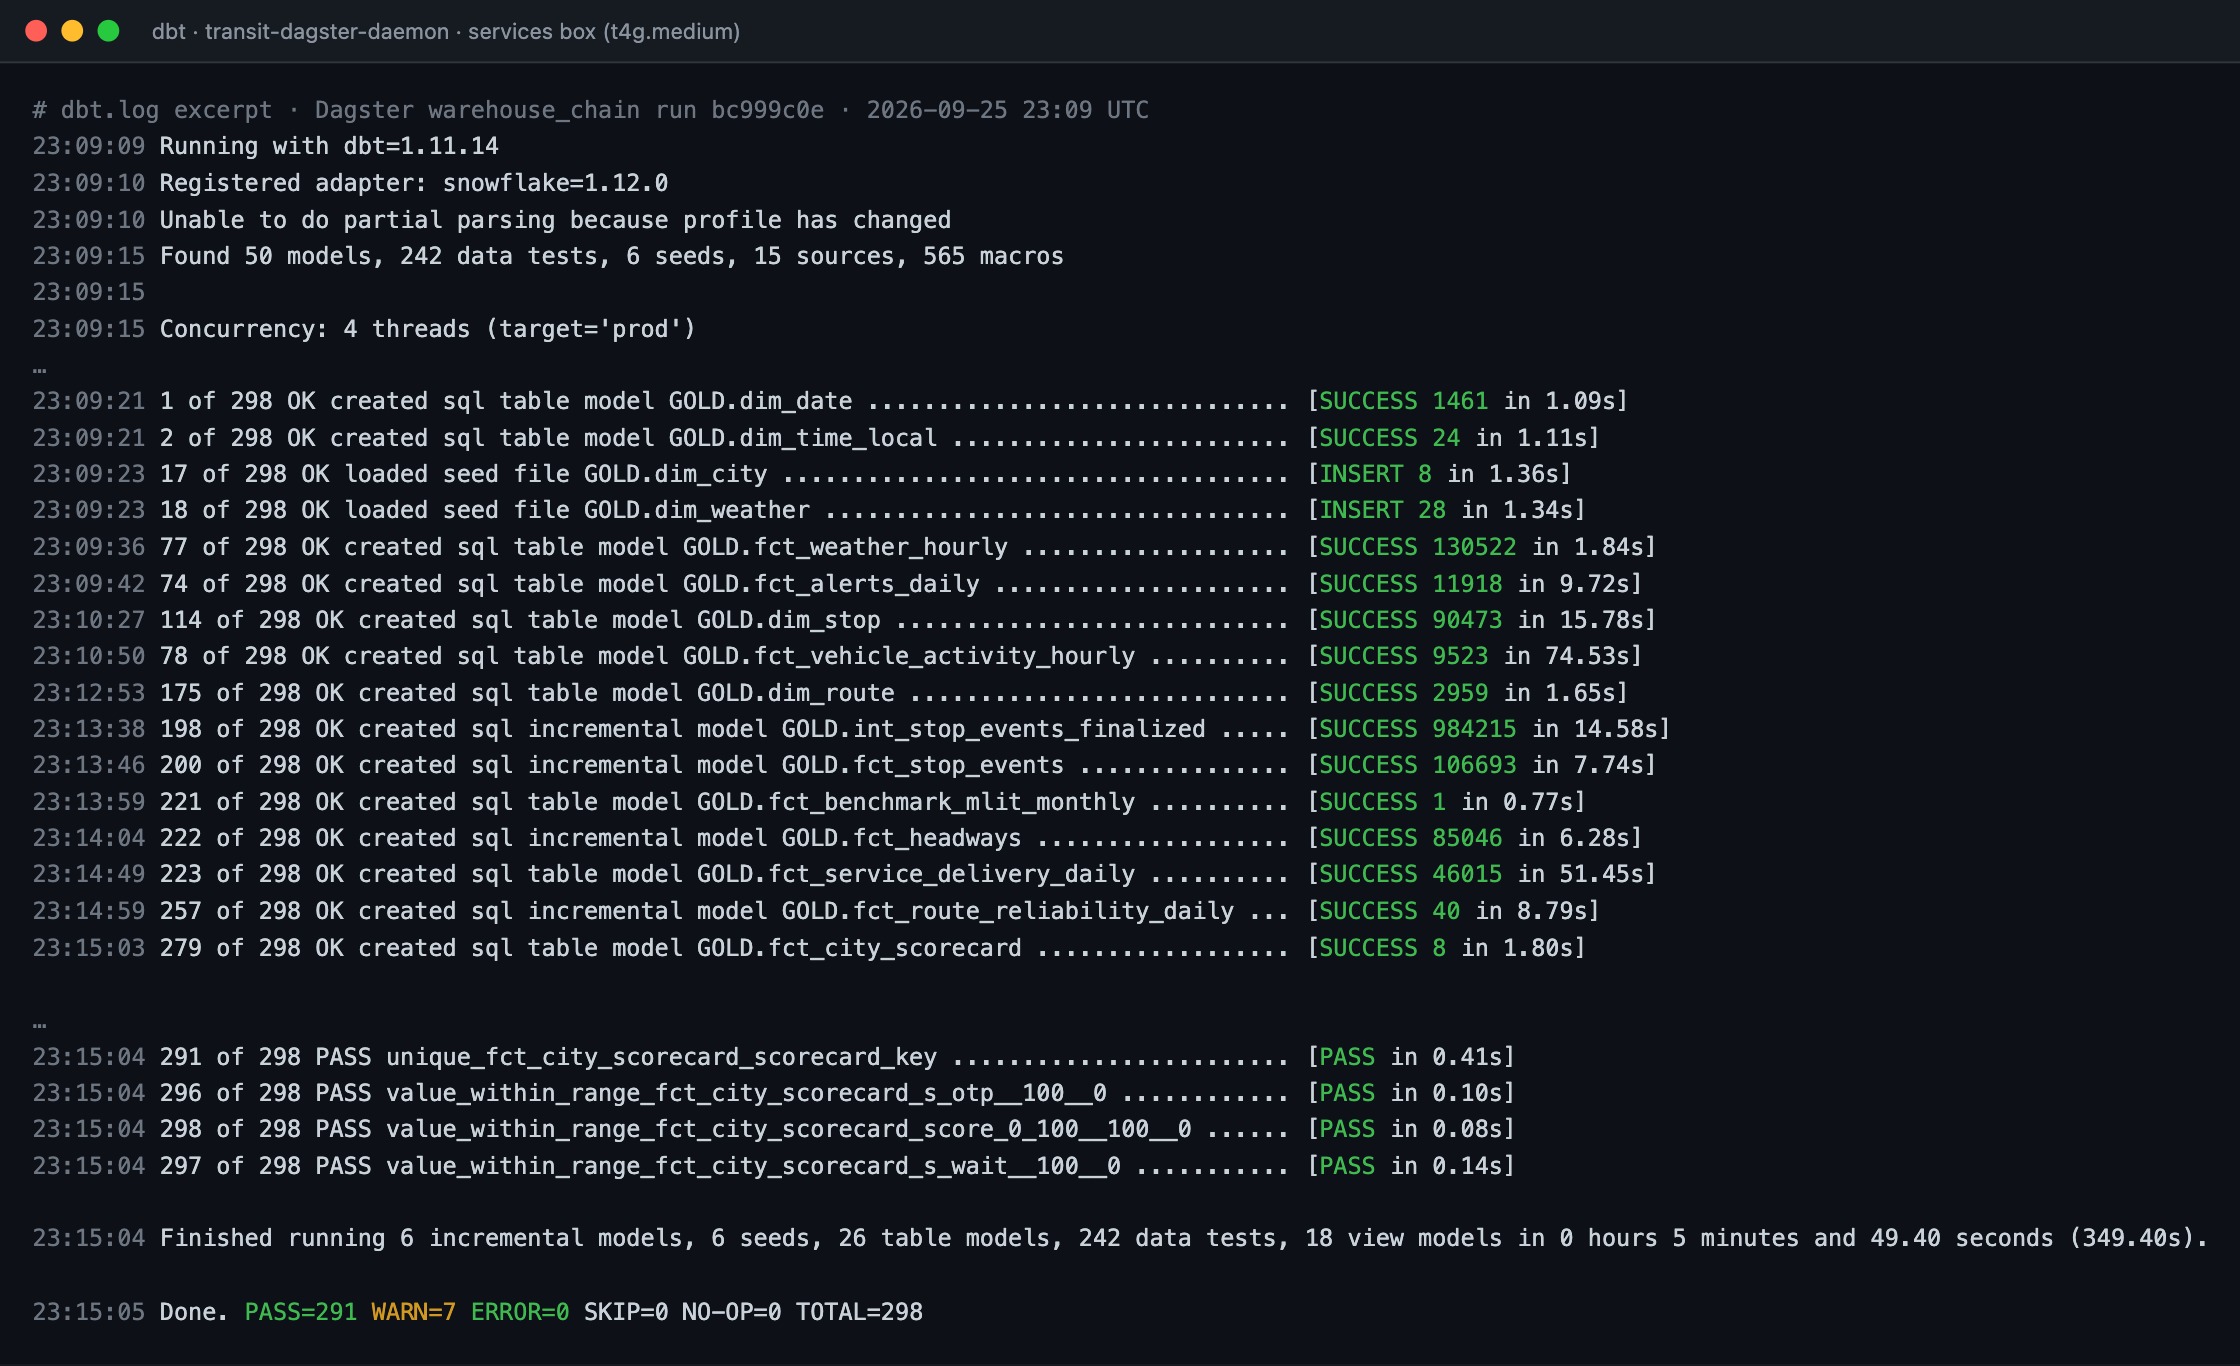
- dbt 1.11.14 on snowflake adapter 1.12.0 finds 50 models, 242 data tests, 6 seeds, 15 sources, and 565 macros, running four threads against target prod.
- The build finishes in 5m49s across 6 incremental models, 6 seeds, 26 table models, 242 data tests, and 18 view models.
- PASS=291 WARN=7 ERROR=0 SKIP=0 over 298 nodes, ending in the 8-row fct_city_scorecard the whole build exists to produce.
The whole dbt project in four lanes.
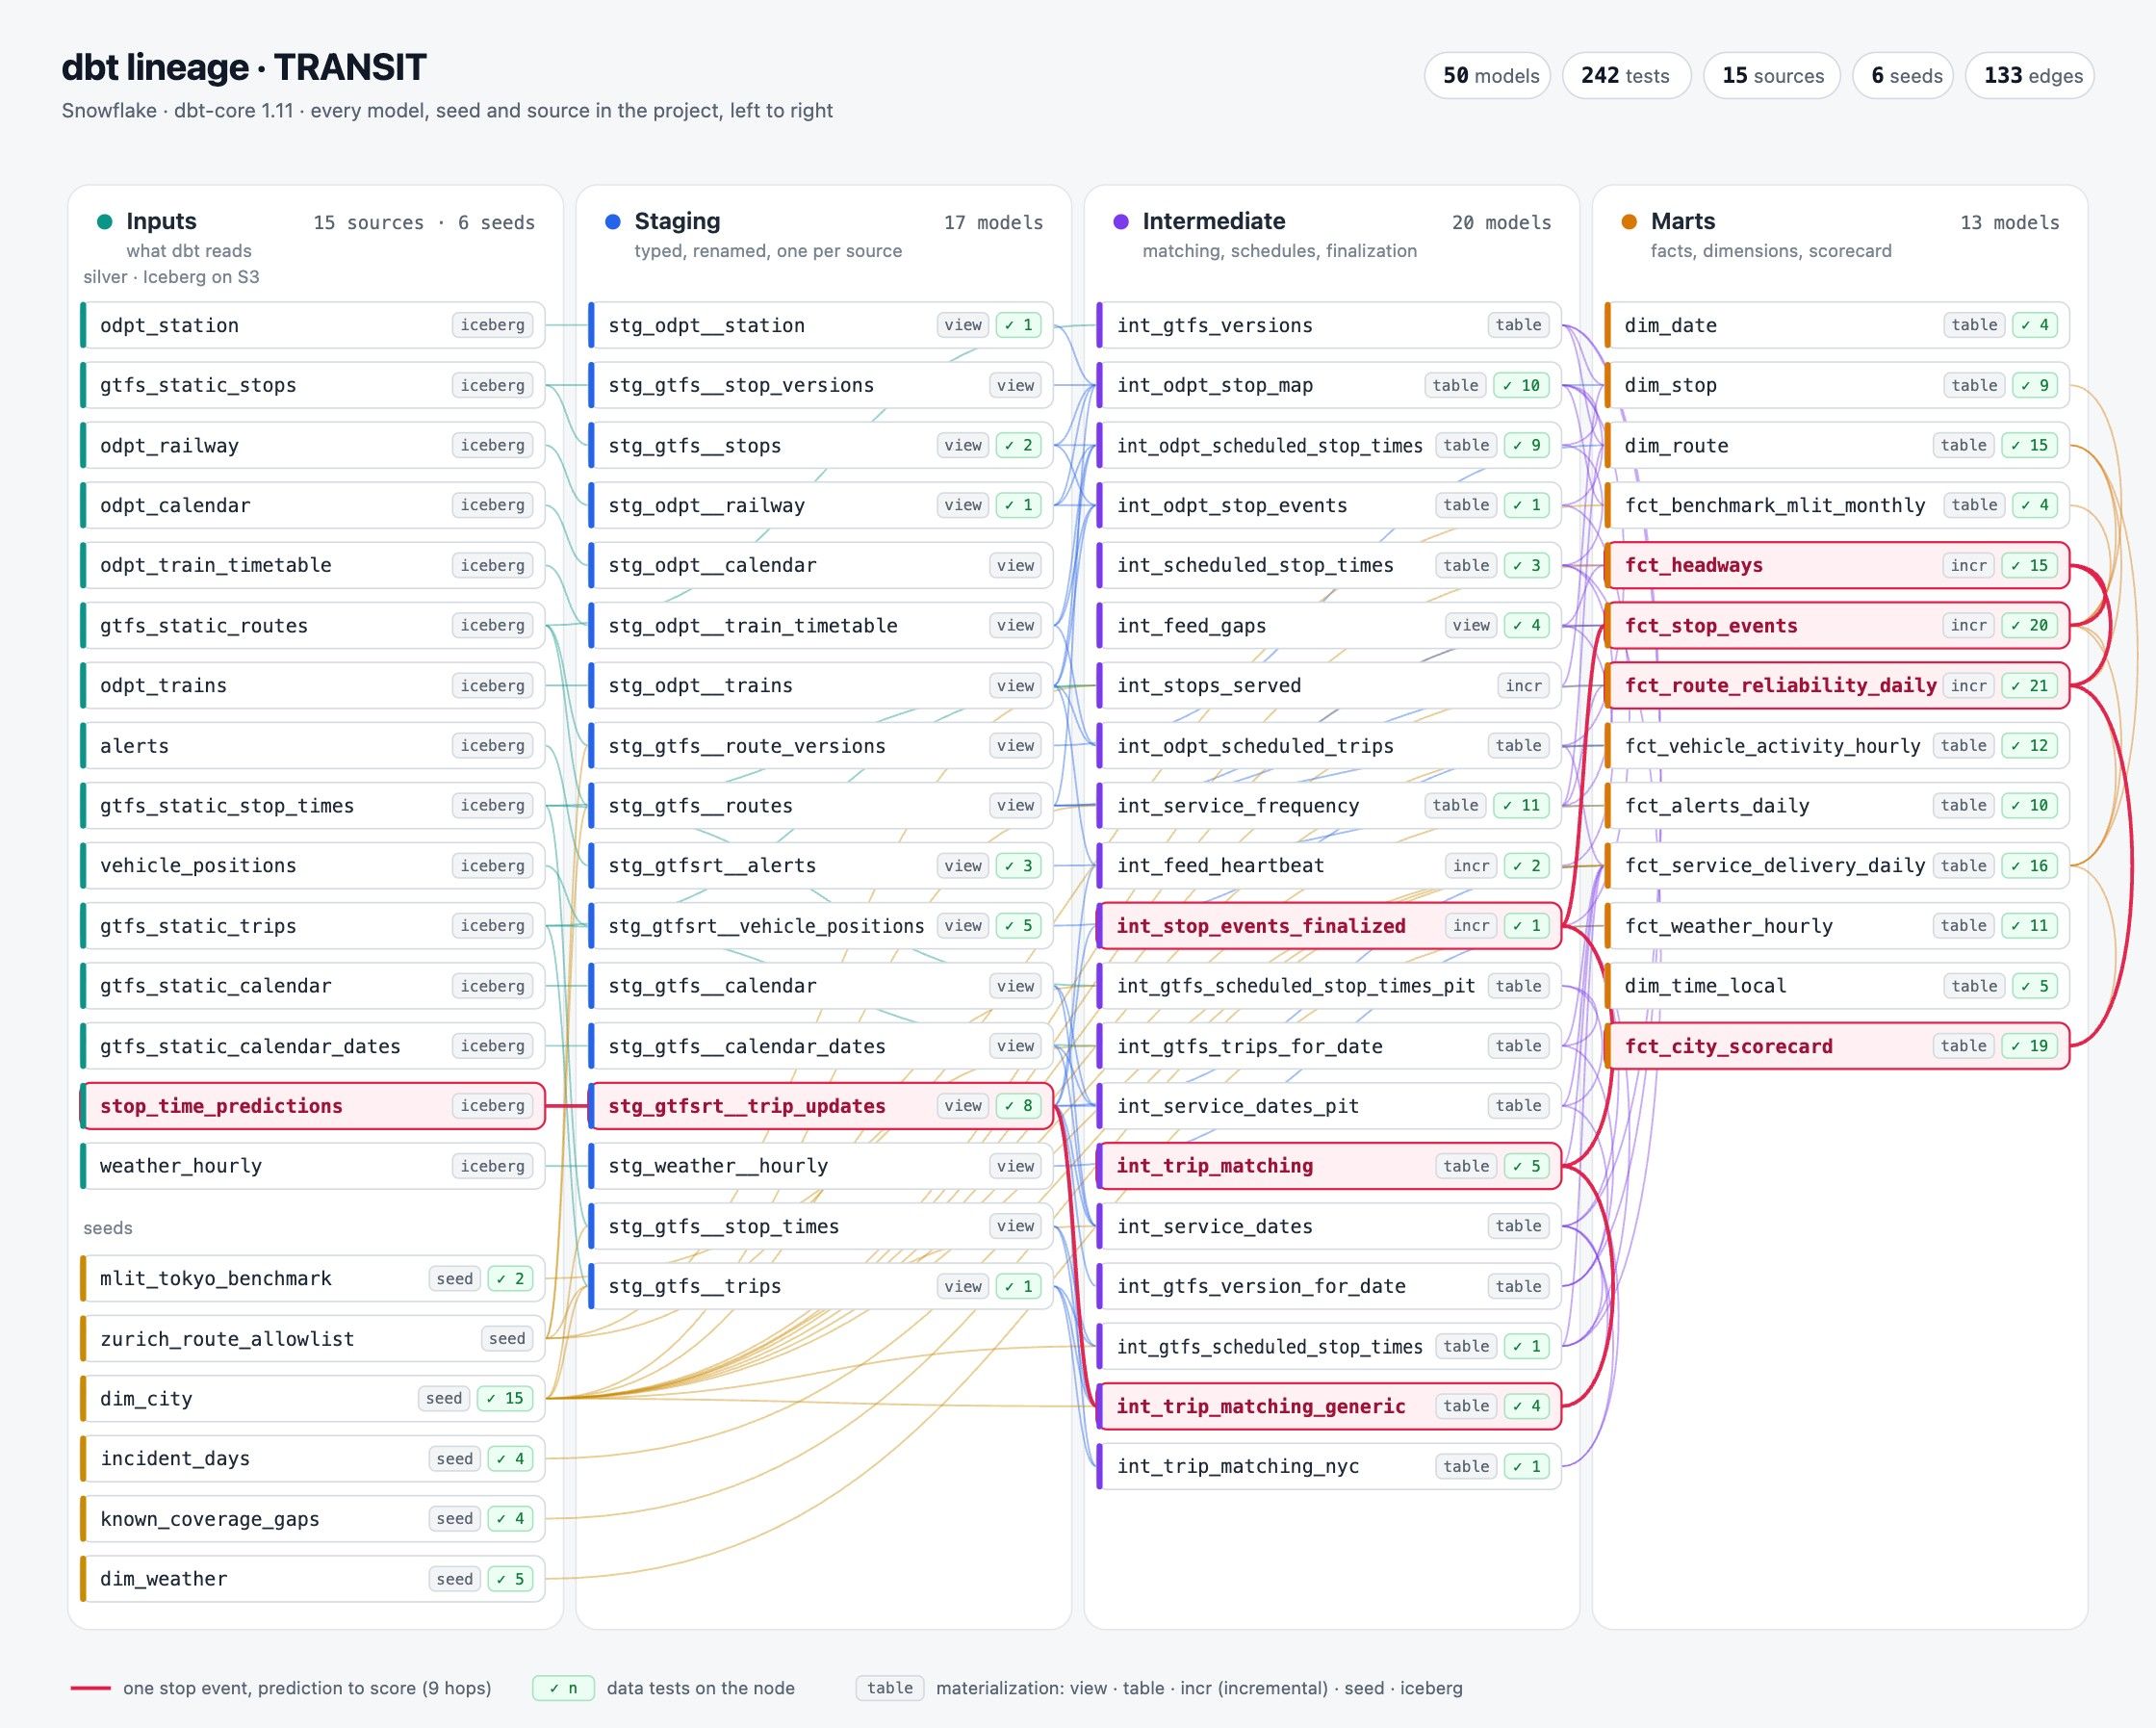
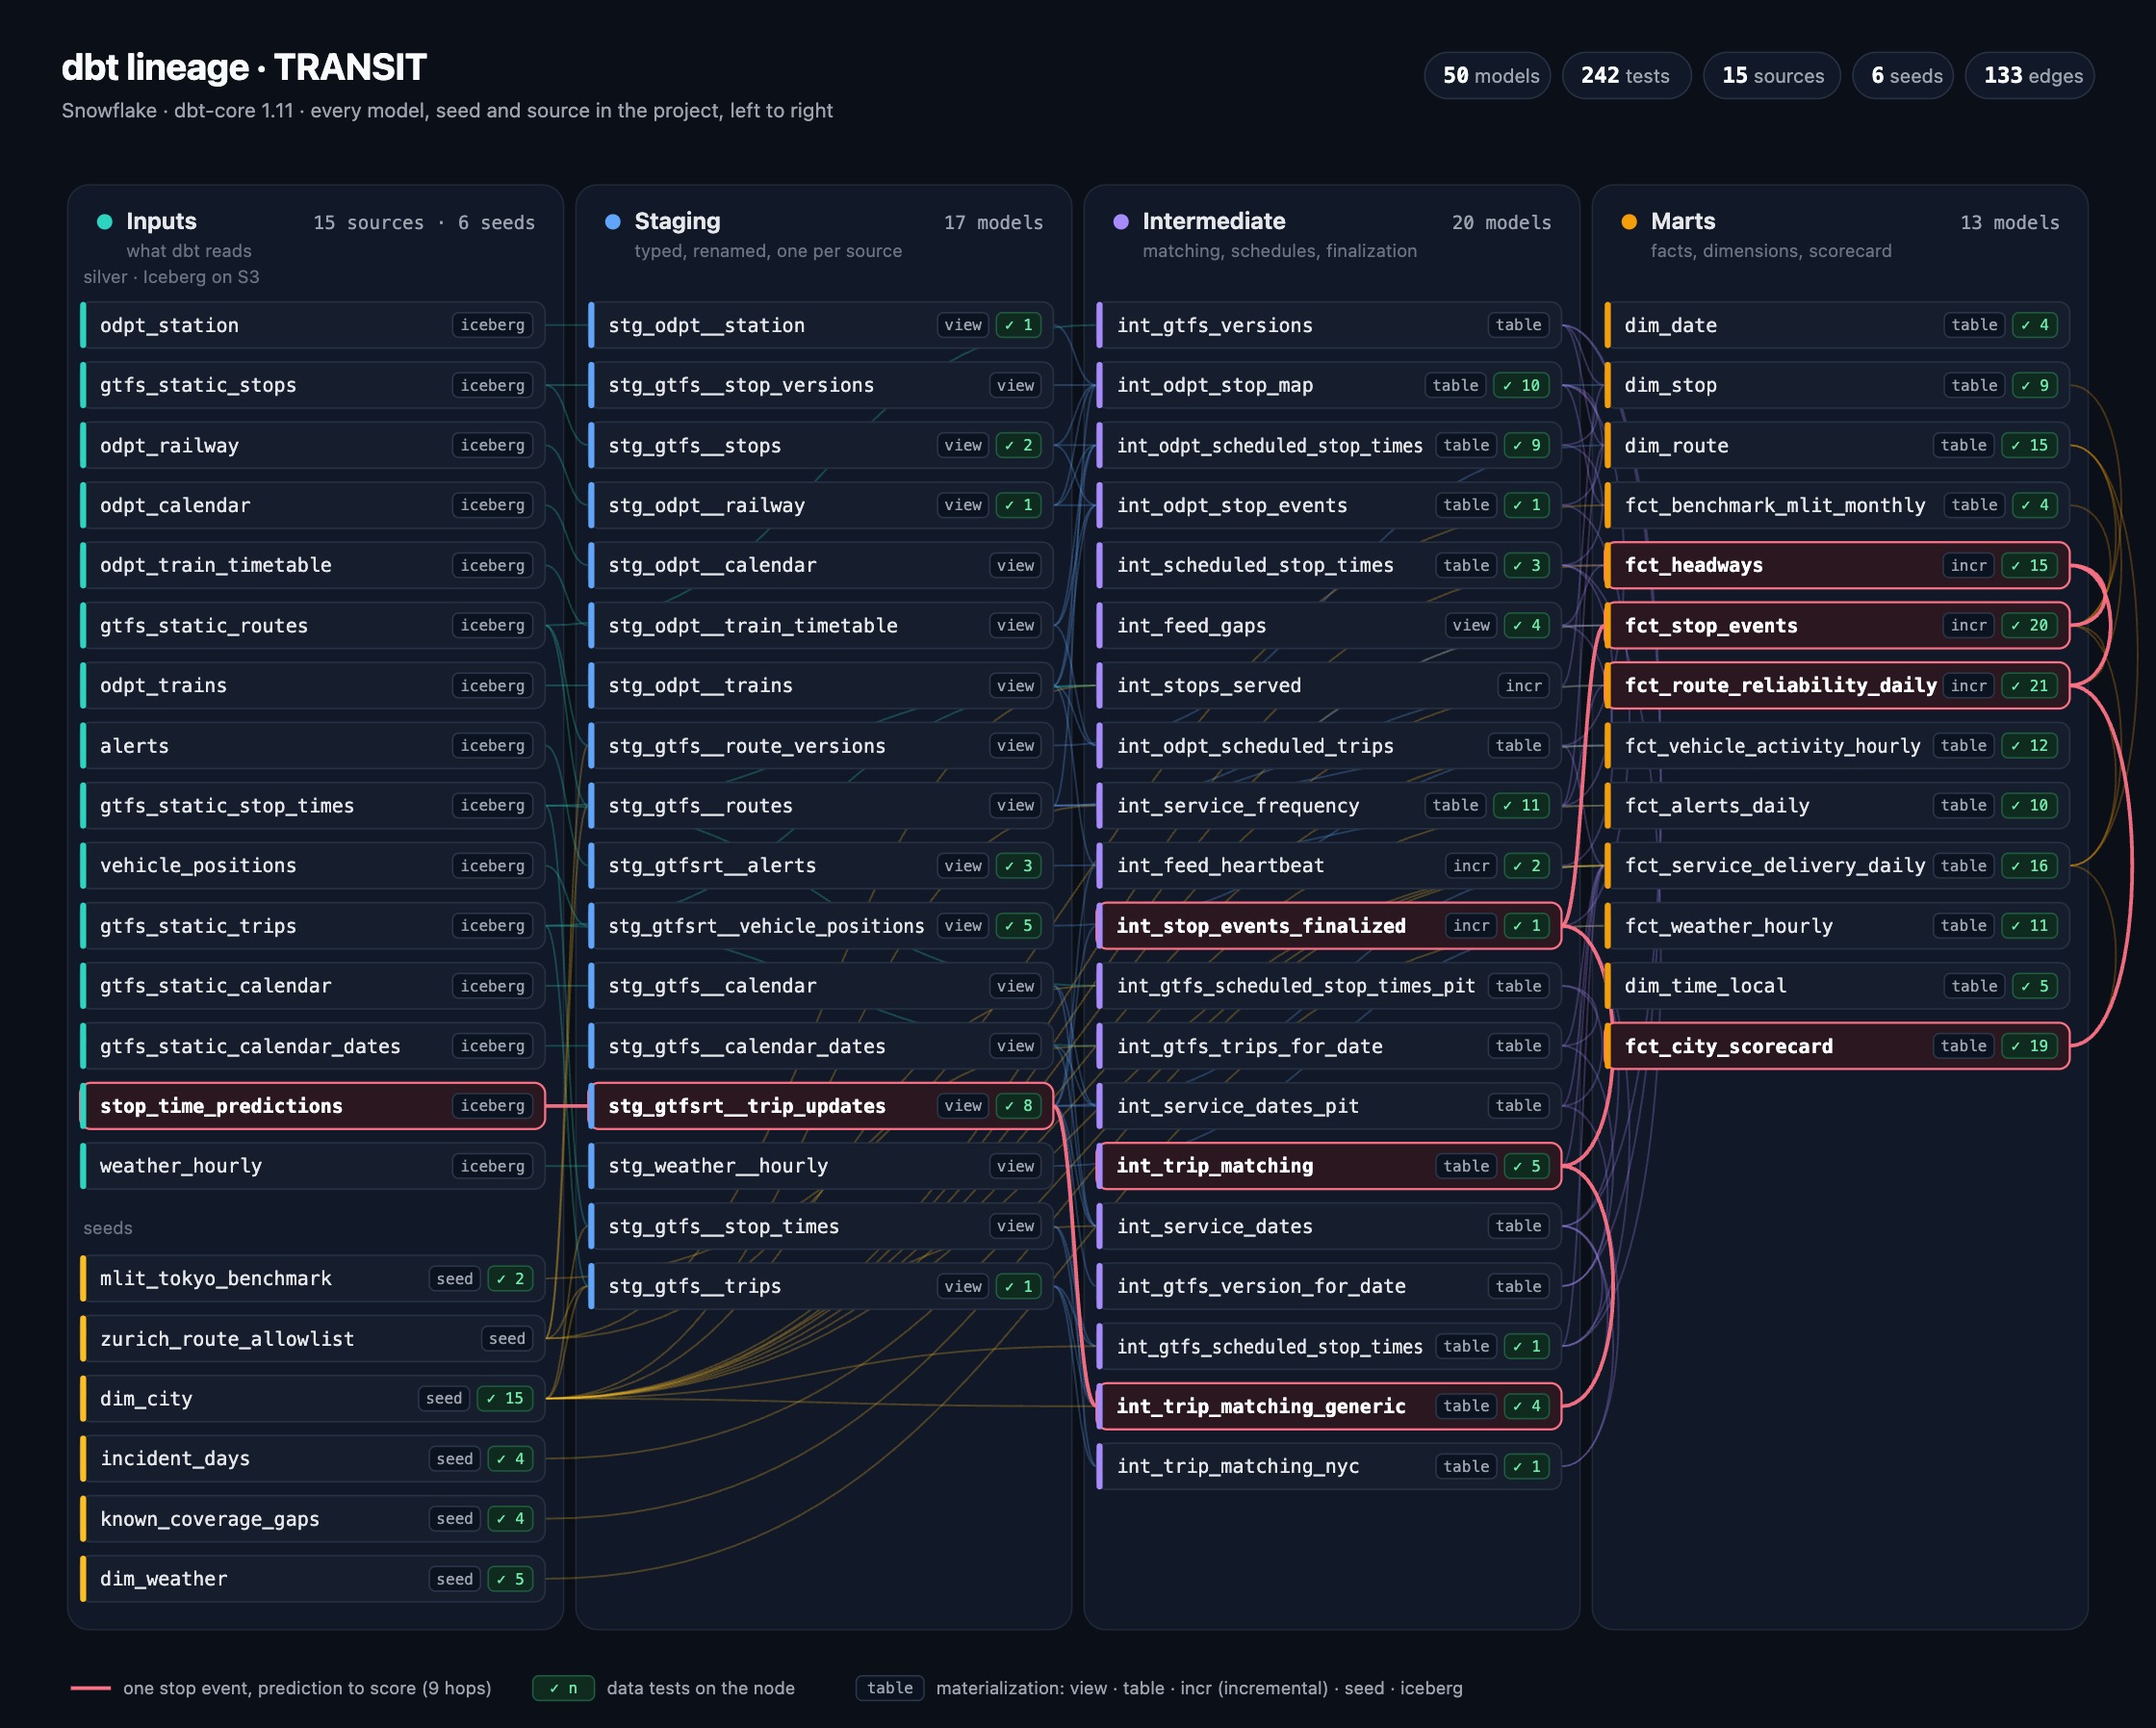
- 71 nodes left to right: 15 Iceberg silver sources and 6 seeds as inputs, 17 staging views, 20 intermediate models carrying trip matching and finalization, and 13 marts — 50 models, 242 tests, 133 edges.
- Every node shows its materialization and its test count, from fct_route_reliability_daily at 21 tests down through fct_stop_events at 20, fct_city_scorecard at 19, and dim_city at 15.
- The red path is the nine hops one stop event takes, from stop_time_predictions through trip matching and finalization to fct_city_scorecard.
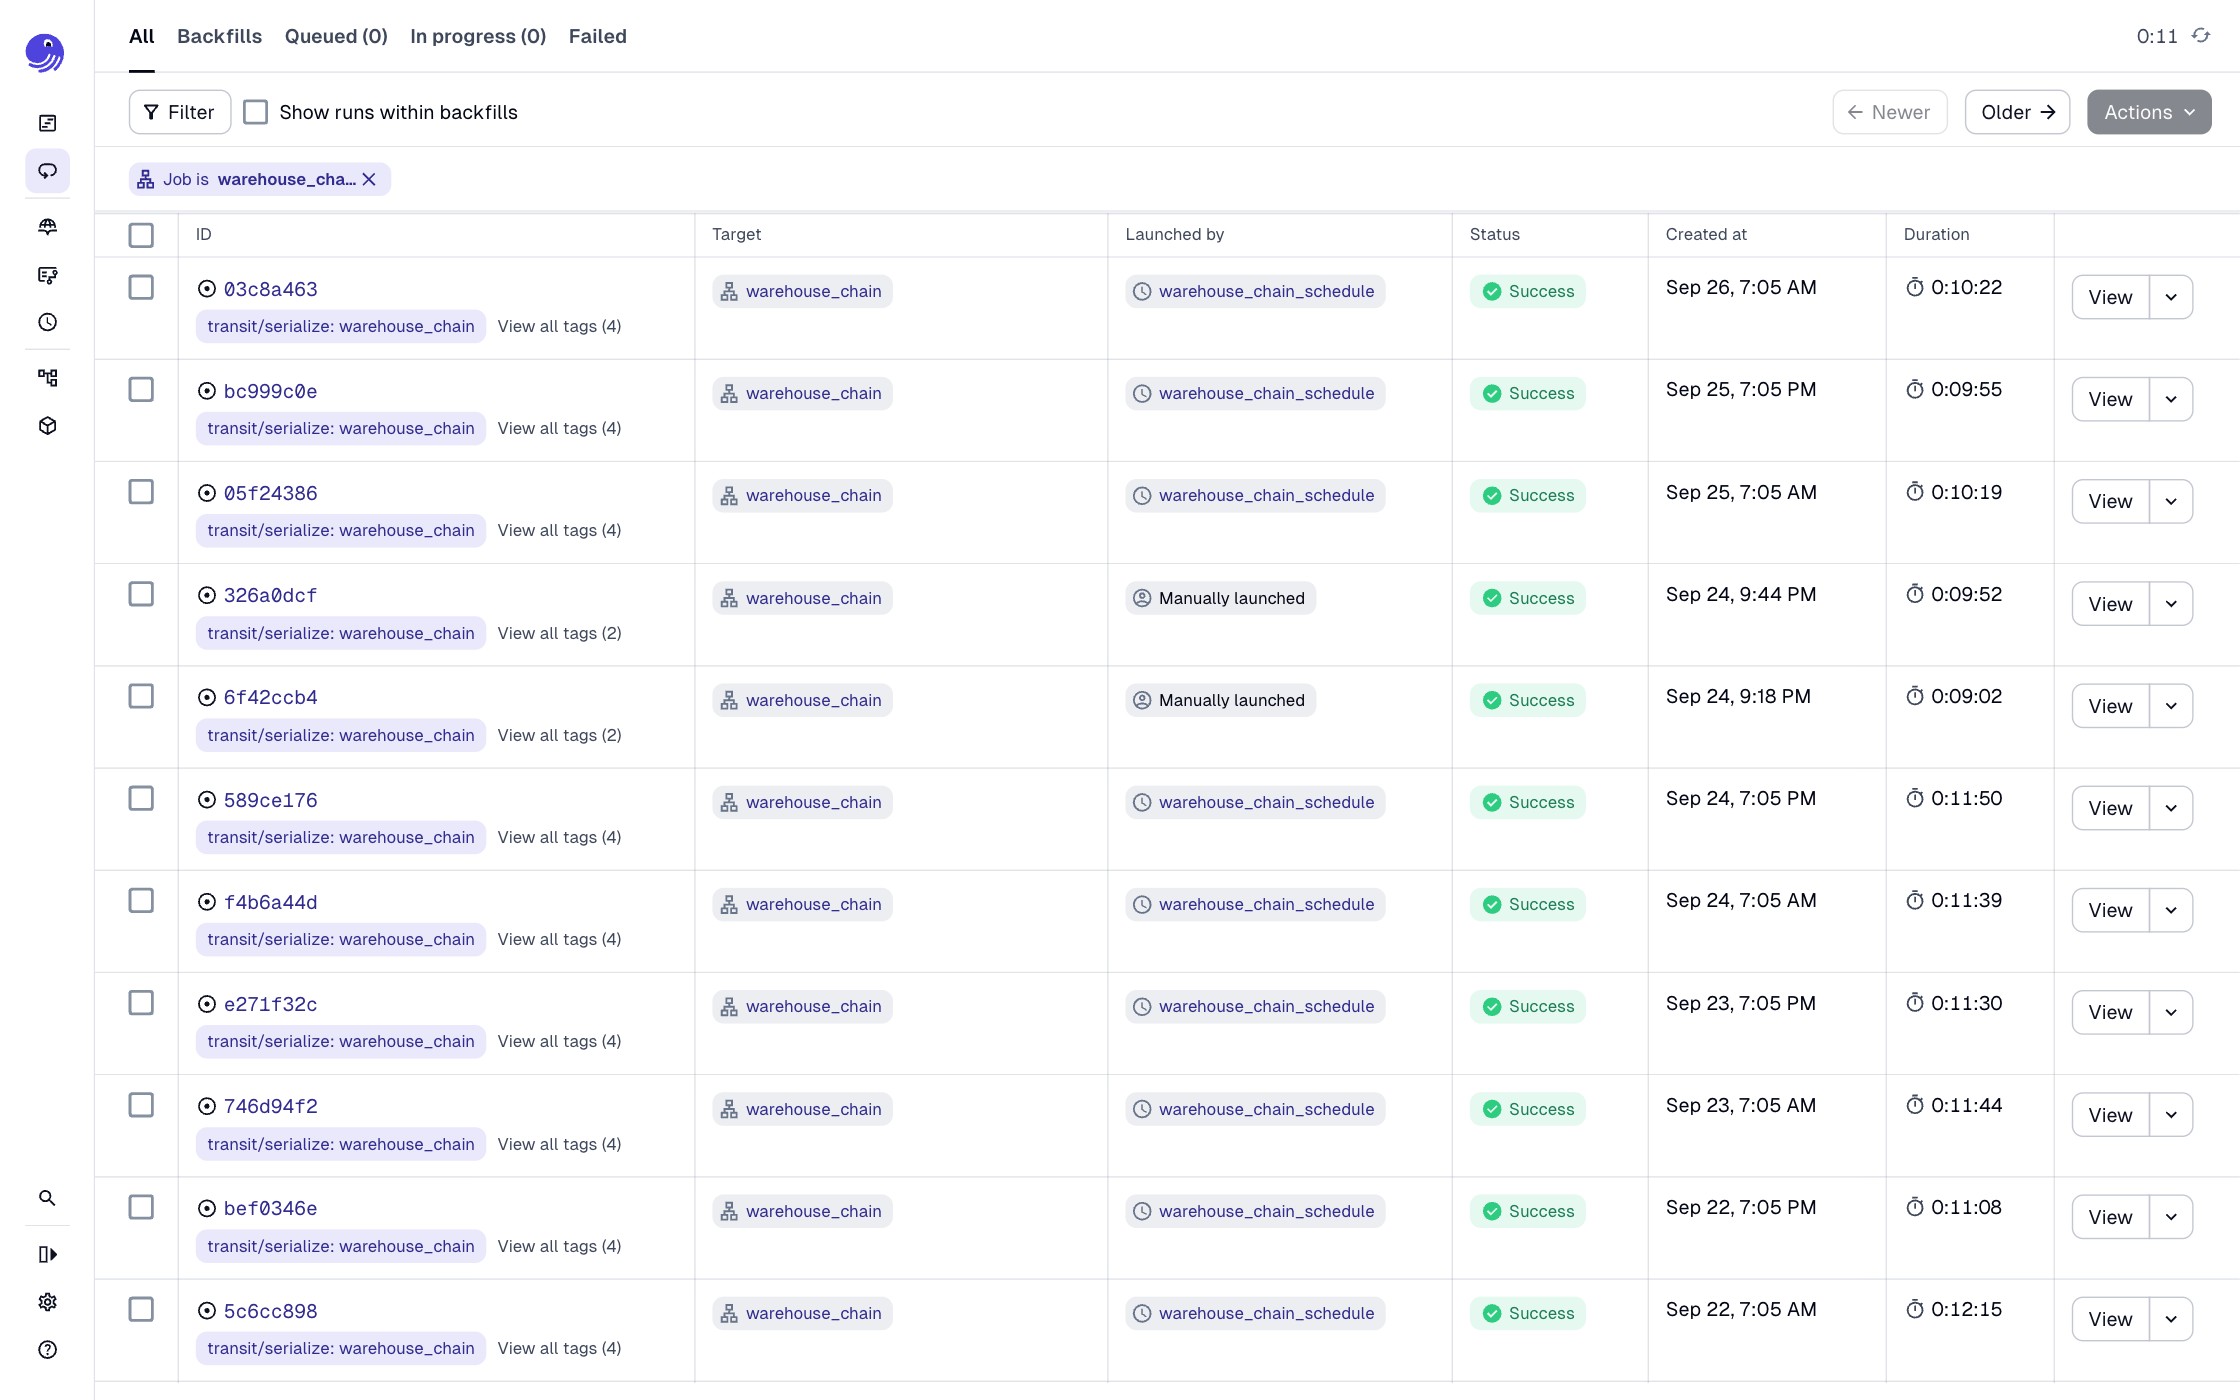
Eleven consecutive green chains.
- September 22 through 26: nine on the twice-daily schedule at 11:05 and 23:05 UTC plus two manual reruns, with durations from 9:02 to 12:15.
- Eleven in a row without a failure is the evidence that the two-hour drain and the twice-daily build both stay inside their windows.
- The chain deliberately runs on its own schedule rather than on every drain, so builds see accumulated data instead of a partial two hours.
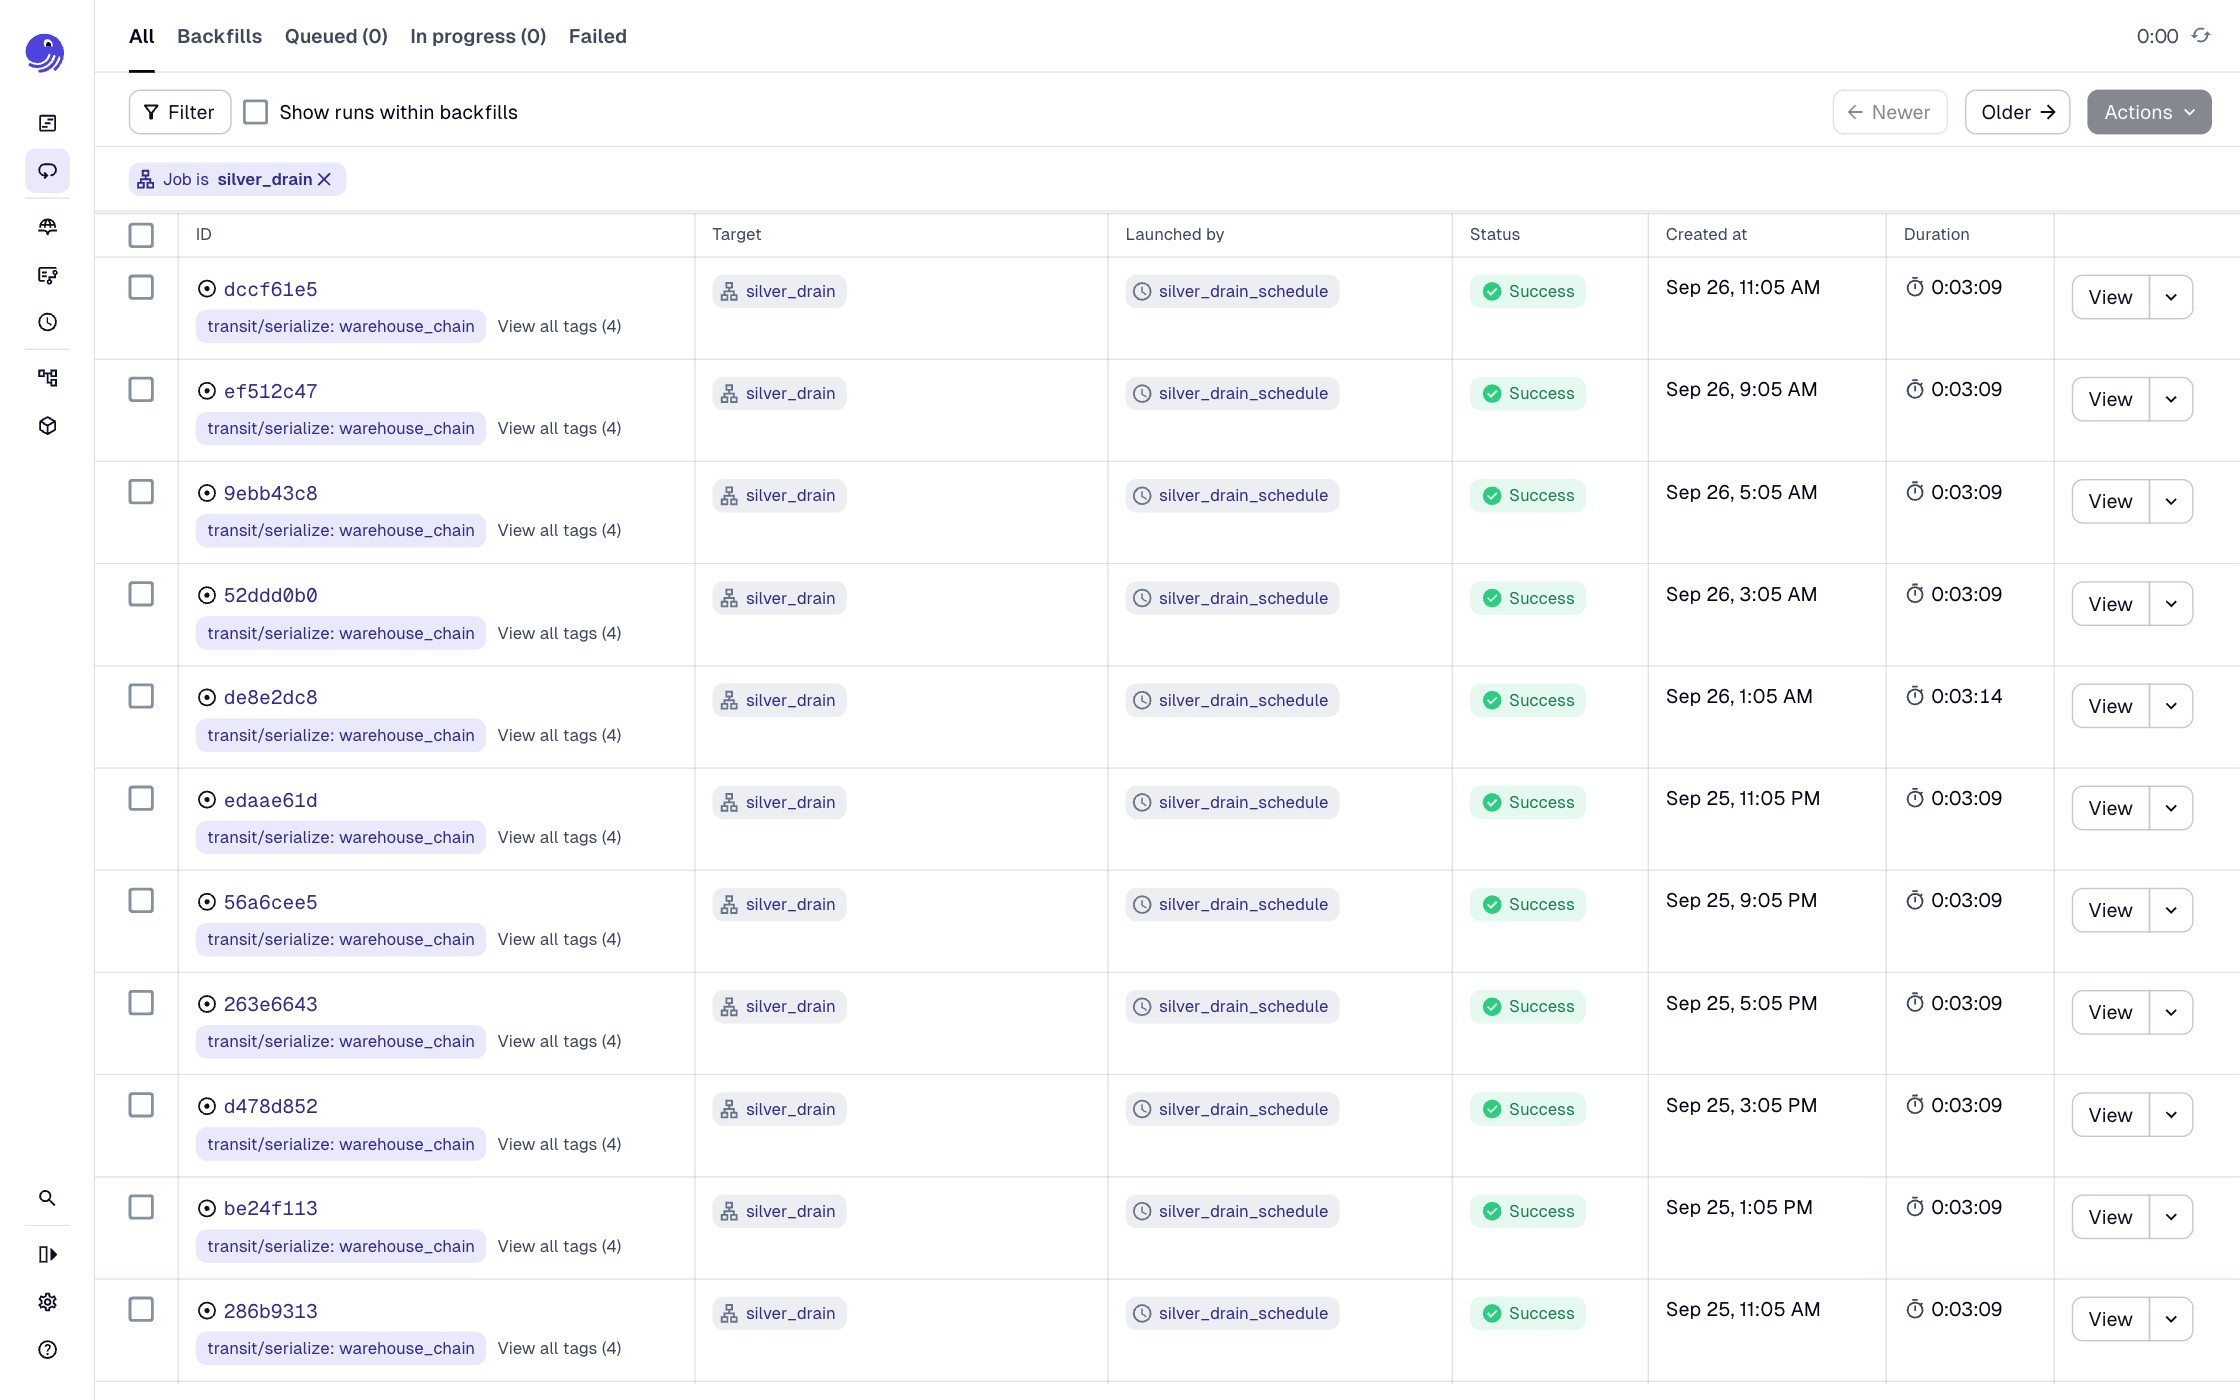
The two-hour drain, 27 runs in view.
- Every silver_drain run in the window succeeded, at roughly three minutes each on a two-hour cadence.
- Two hours is not an arbitrary interval: silver drops exact duplicates inside a two-hour watermark, so the drain cadence and the dedupe window are the same number.
- This is the job that turns Kafka's 24-hour buffer into Iceberg rows, which leaves twelve drains of replay margin.
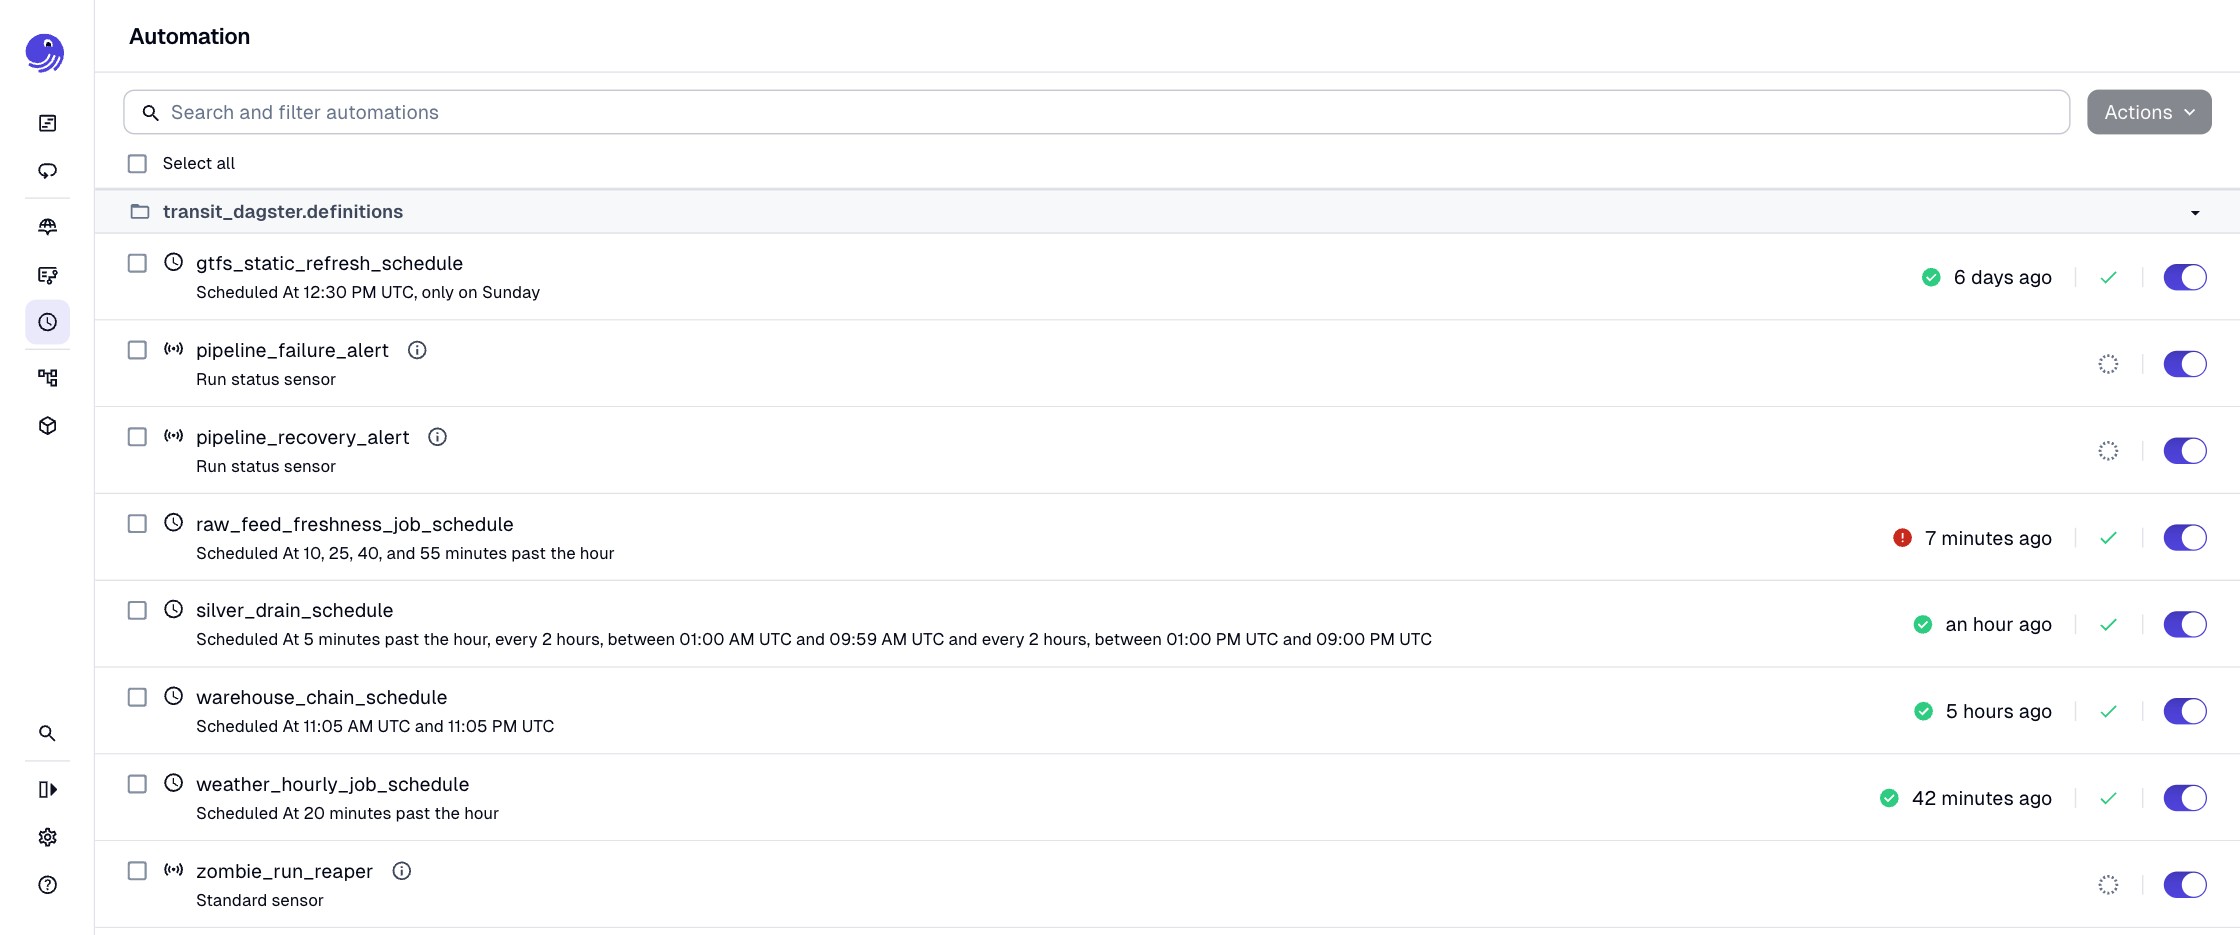
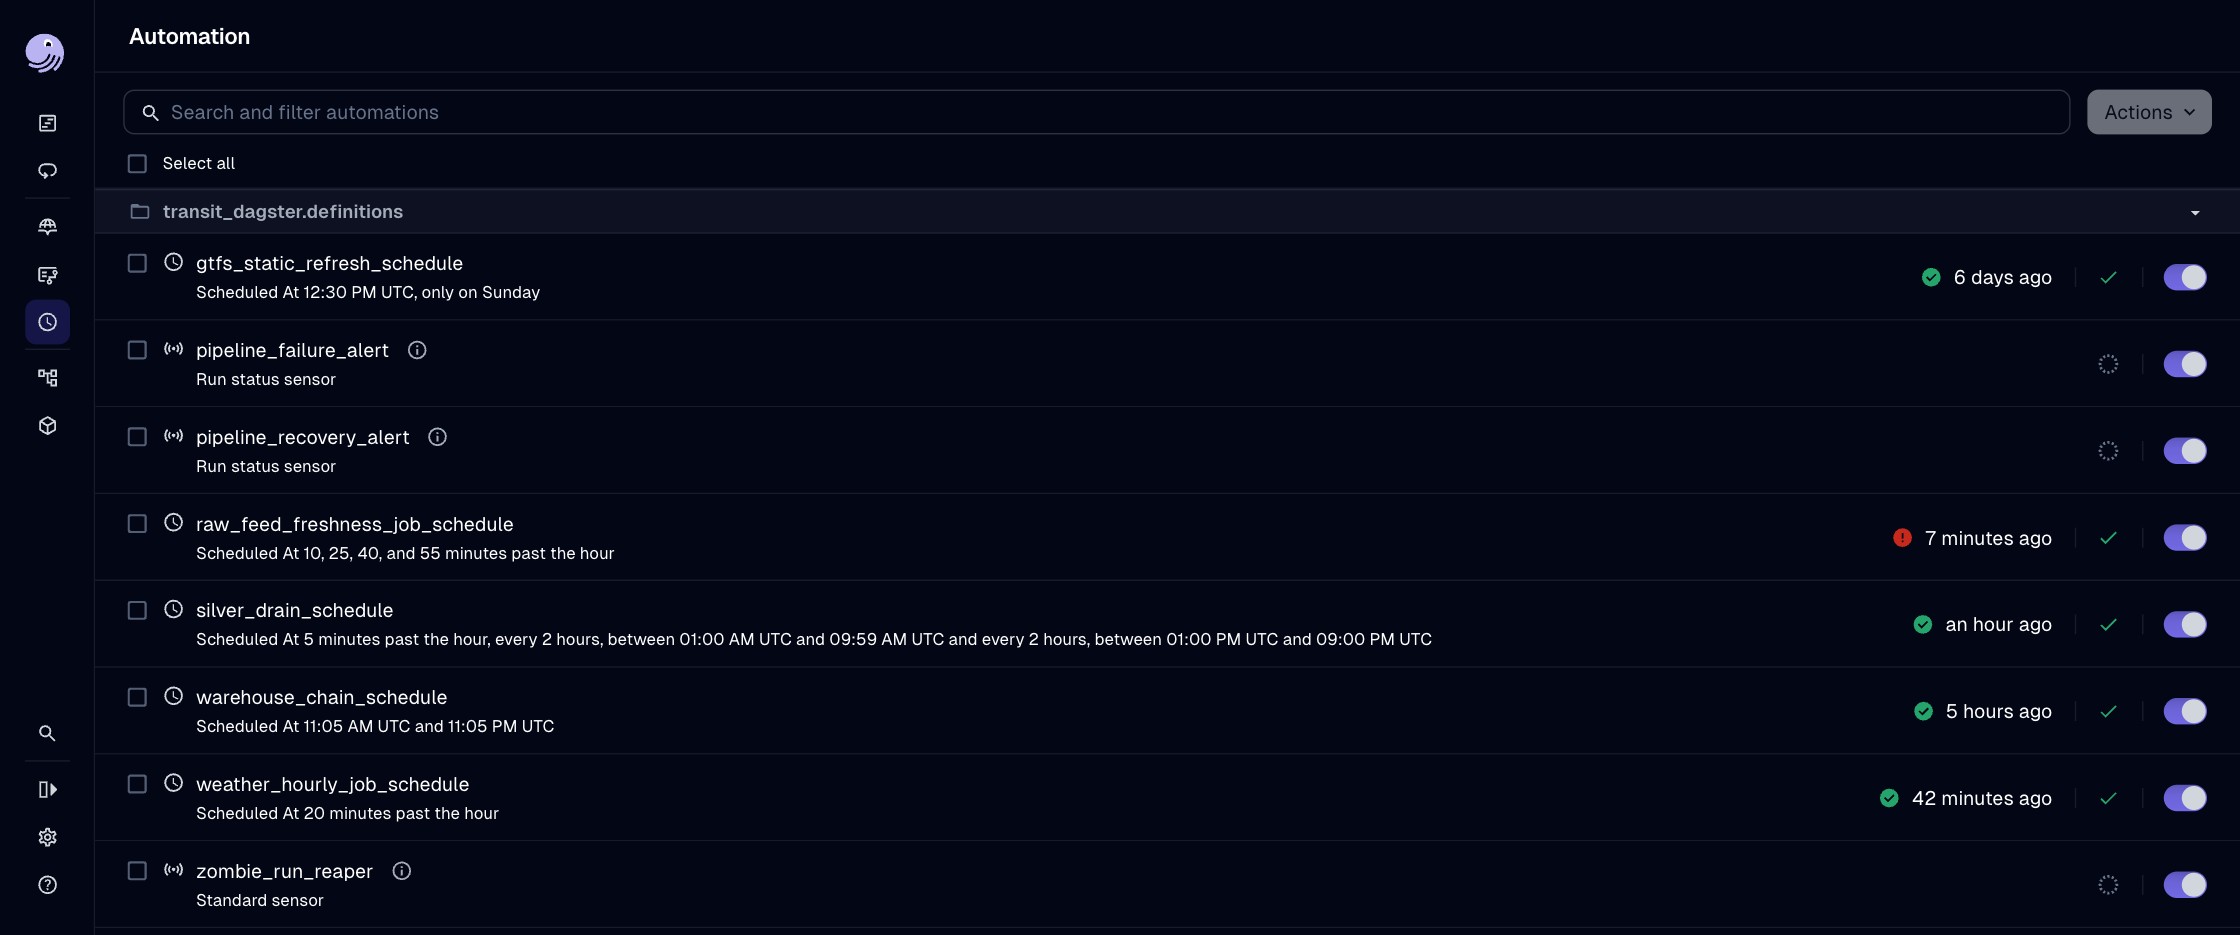
Five schedules, three sensors, one control plane.
- gtfs_static_refresh Sundays at 12:30 UTC, raw_feed_freshness four times an hour, silver_drain every two hours, warehouse_chain at 11:05 and 23:05, weather_hourly at :20.
- The red dot on raw_feed_freshness is the tripwire doing its job: every city is retired, so the freshness check fails loudly by design.
- Three sensors cover what schedules cannot — pipeline_failure_alert, pipeline_recovery_alert, and a zombie_run_reaper.
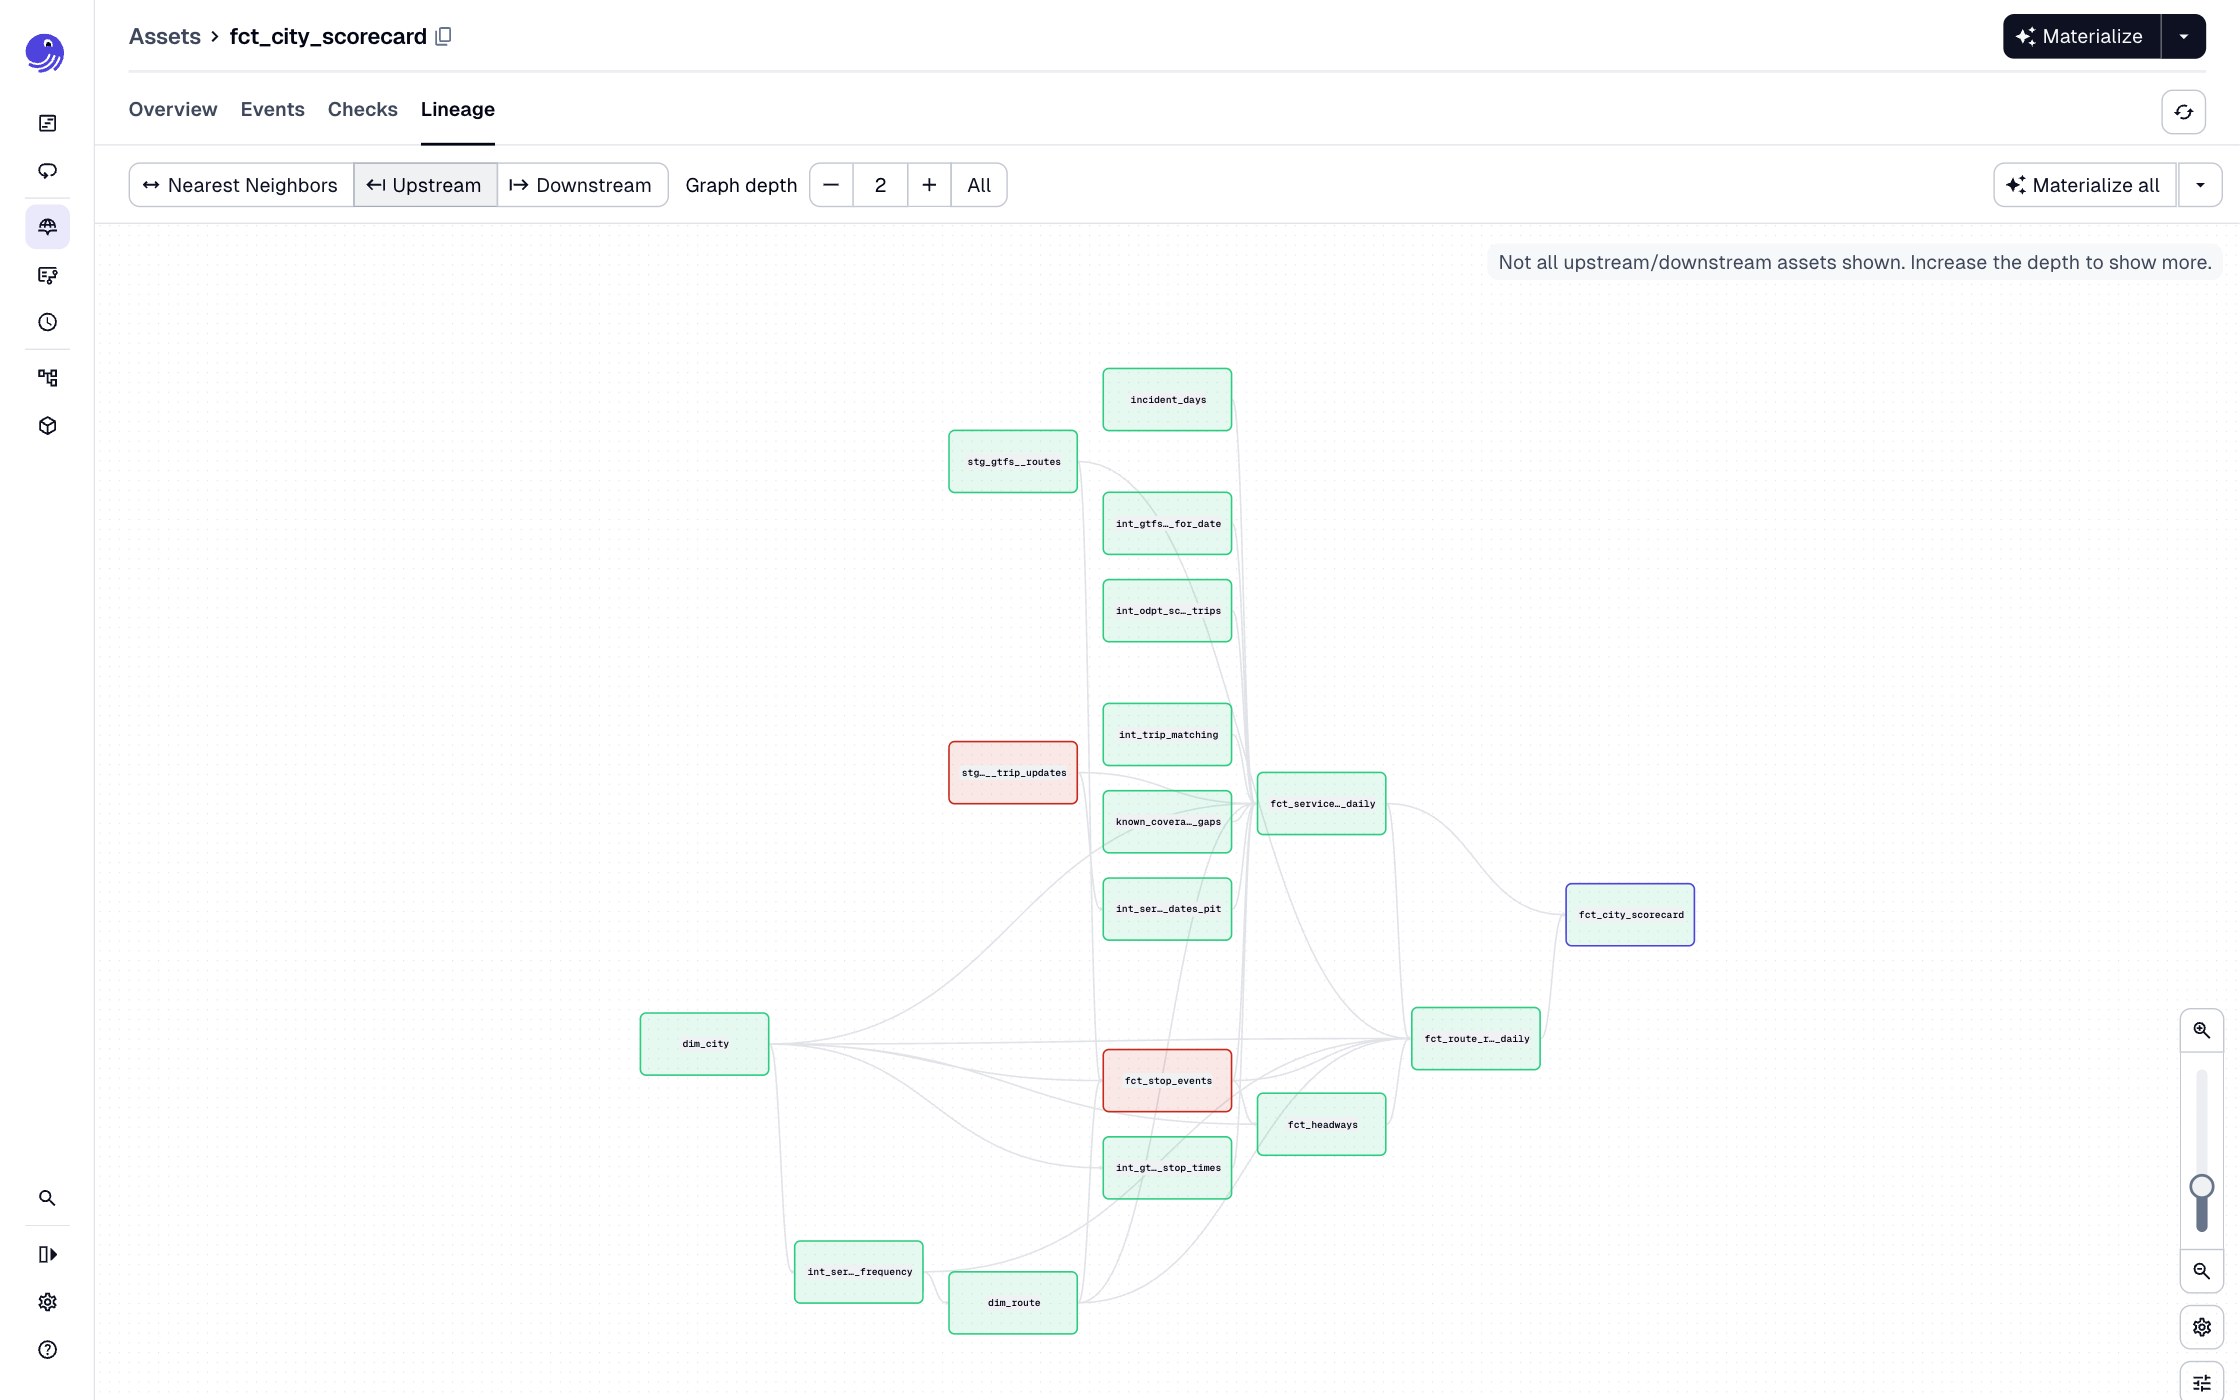
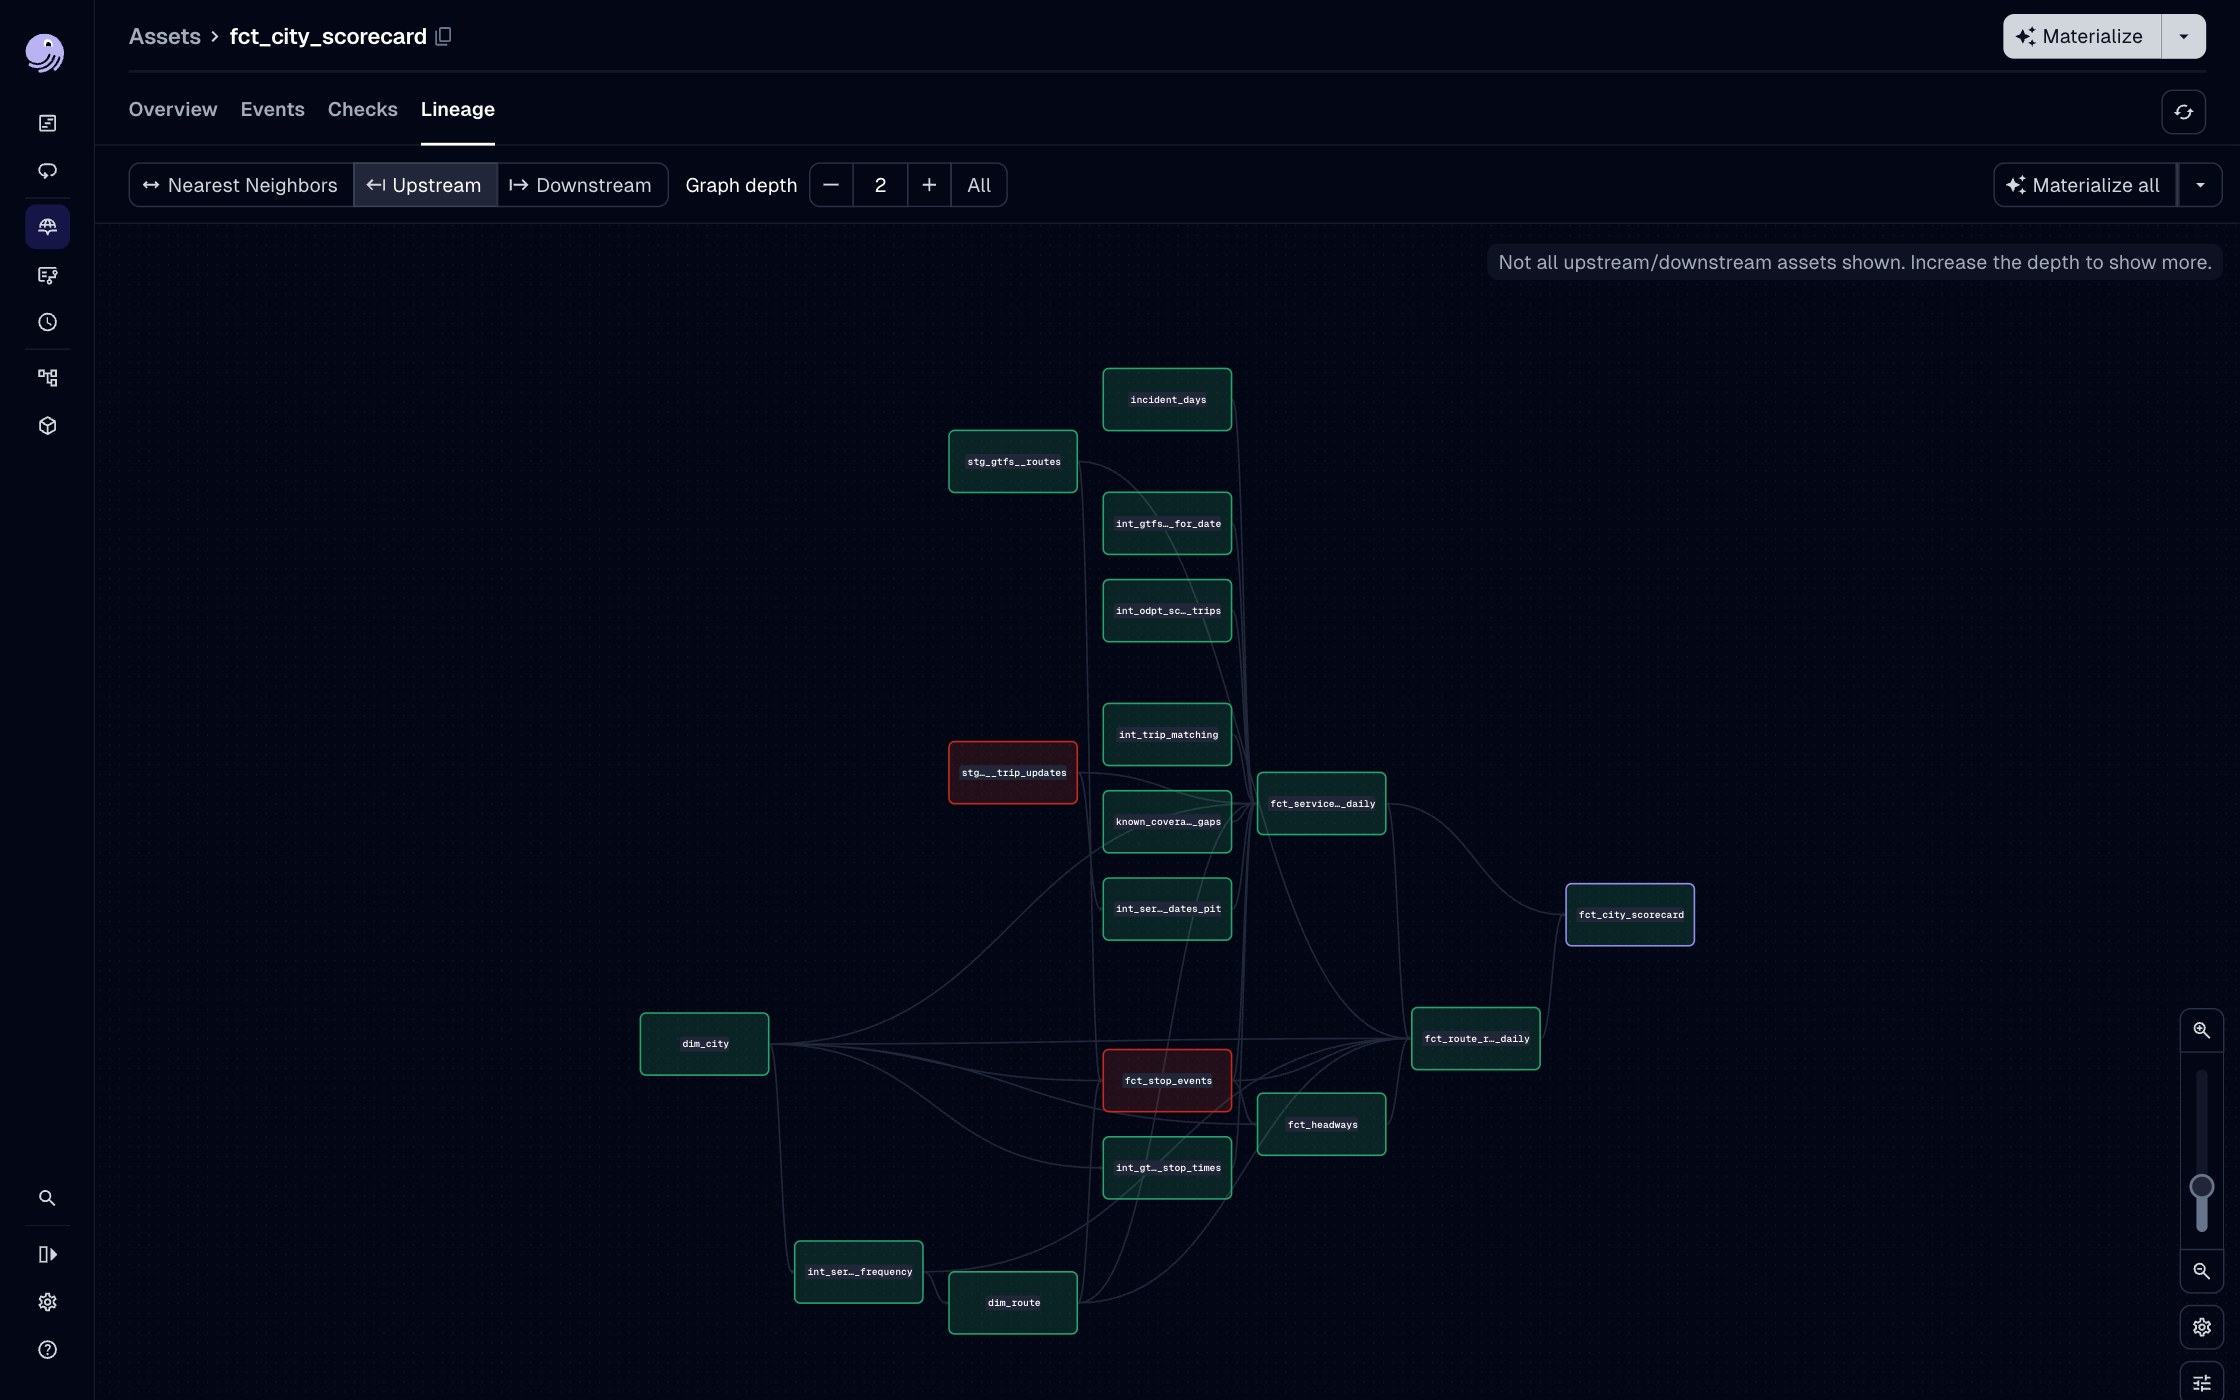
What the scorecard depends on, two levels up.
- fct_city_scorecard draws on service delivery, route reliability, headways, and stop events, plus dim_city, dim_route, and the incident_days and known_coverage_gaps seeds.
- Those seeds are how known bad days are excluded by record rather than by hand.
- The two red nodes are freshness checks failing because every feed is retired, the same by-design failure the schedule tripwire shows.
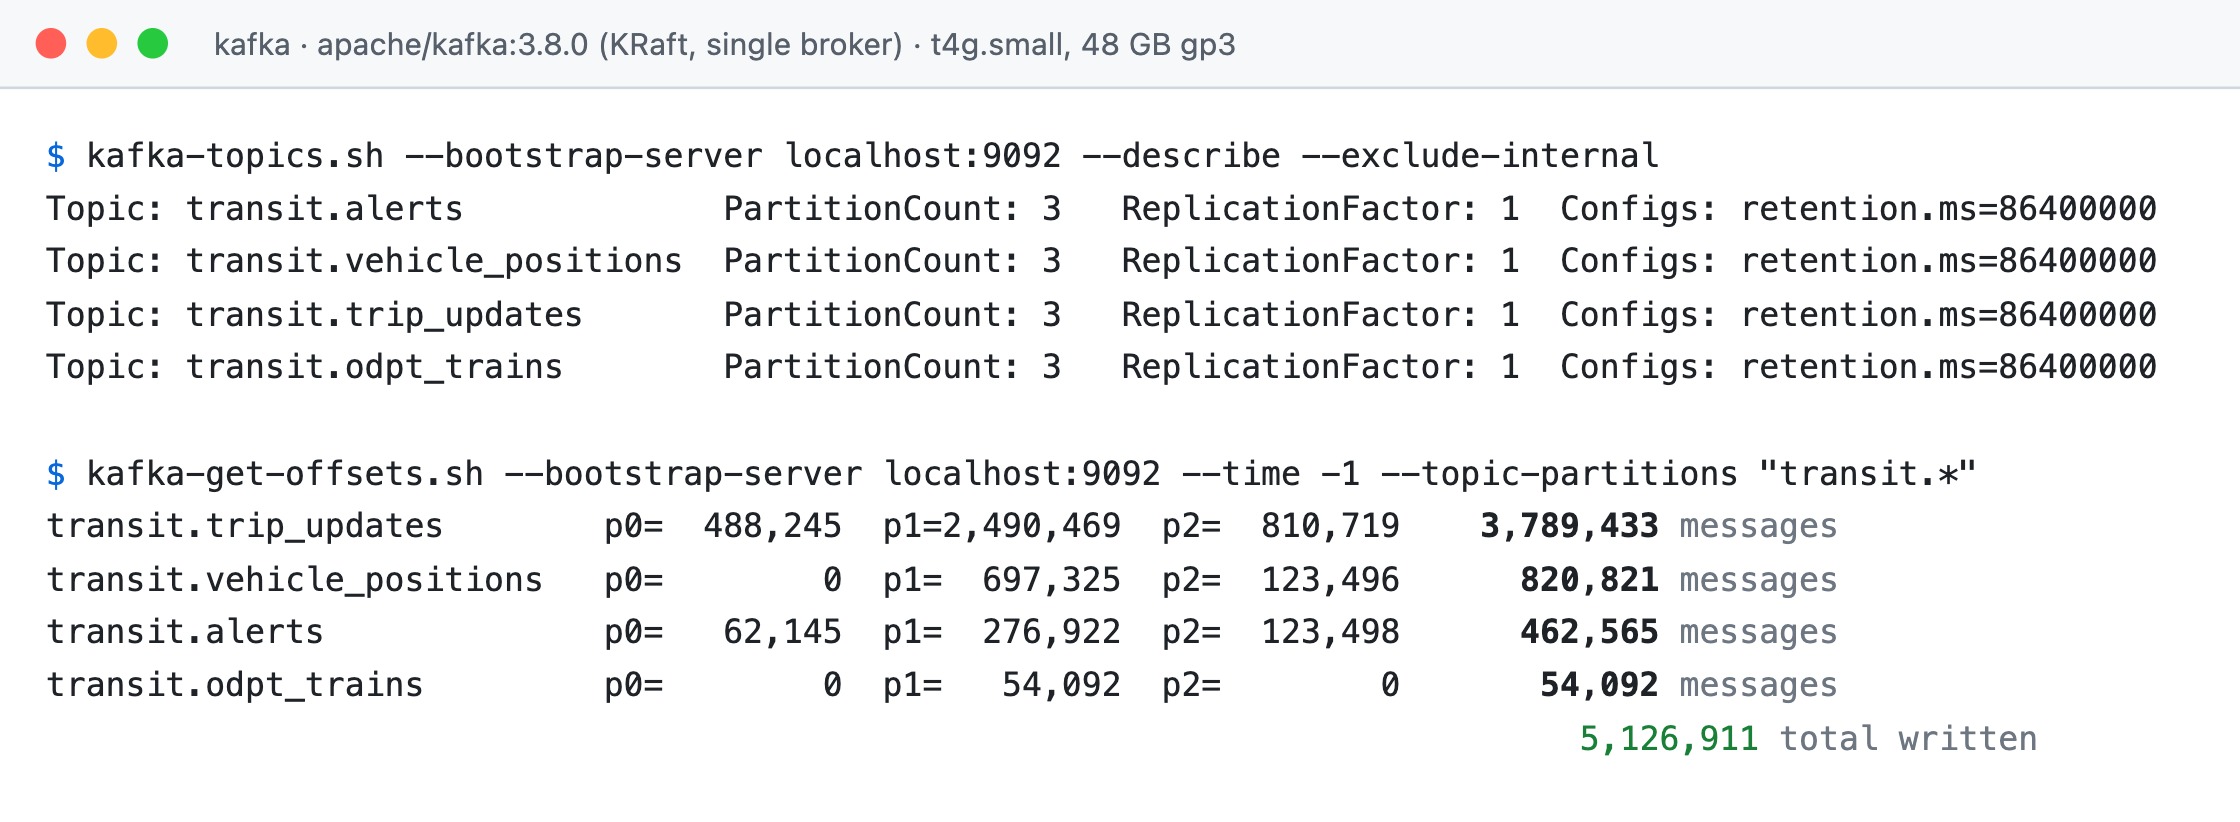
The buffer: four topics, 5.1 million messages.
- trip_updates 3,789,433, vehicle_positions 820,821, alerts 462,565, and odpt_trains 54,092 written across four topics at three partitions each.
- Replication factor 1 on a single broker. The durability that matters lives in the raw S3 archive written before any decode, so the broker holds nothing that cannot be rebuilt.
- 24-hour retention against a two-hour drain leaves twelve drains of replay margin.
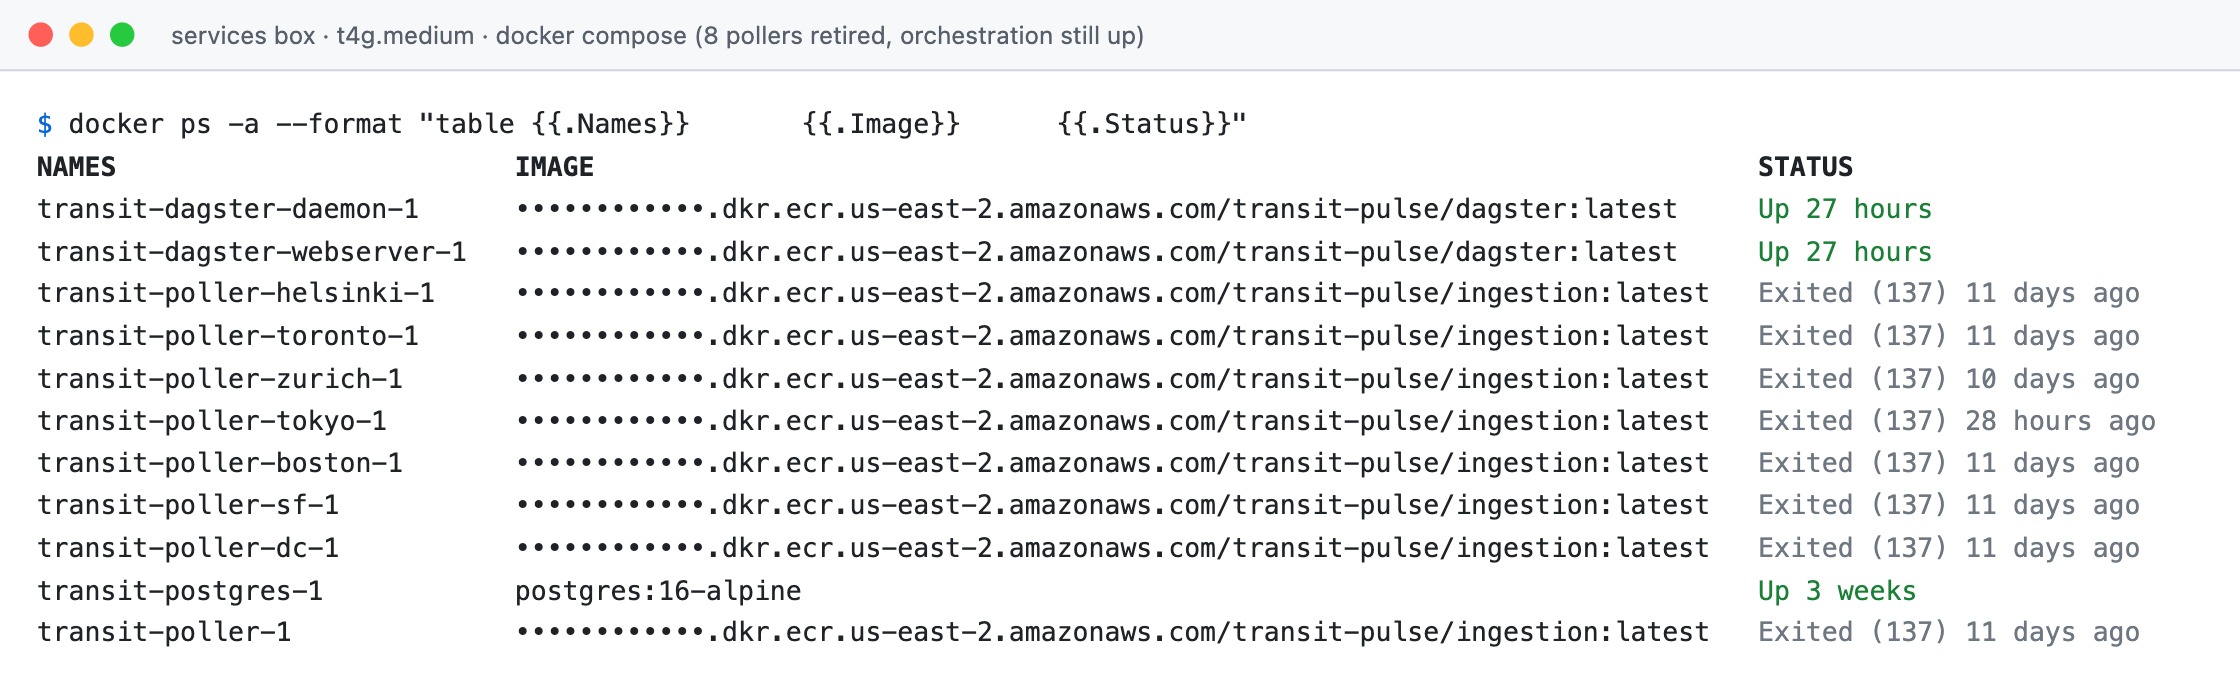
One image, eight pollers, all retired.
- Eight poller containers run from a single ingestion image and differ only in configuration; transit-poller-1 is the New York one.
- All eight read exited. Each city's poller was retired once it banked its twentieth judged day, most on 2026-09-14 and 15 and Tokyo last on 2026-09-25.
- The Dagster daemon, webserver, and Postgres stay up, which is why the warehouse chain still runs against data that stopped arriving.
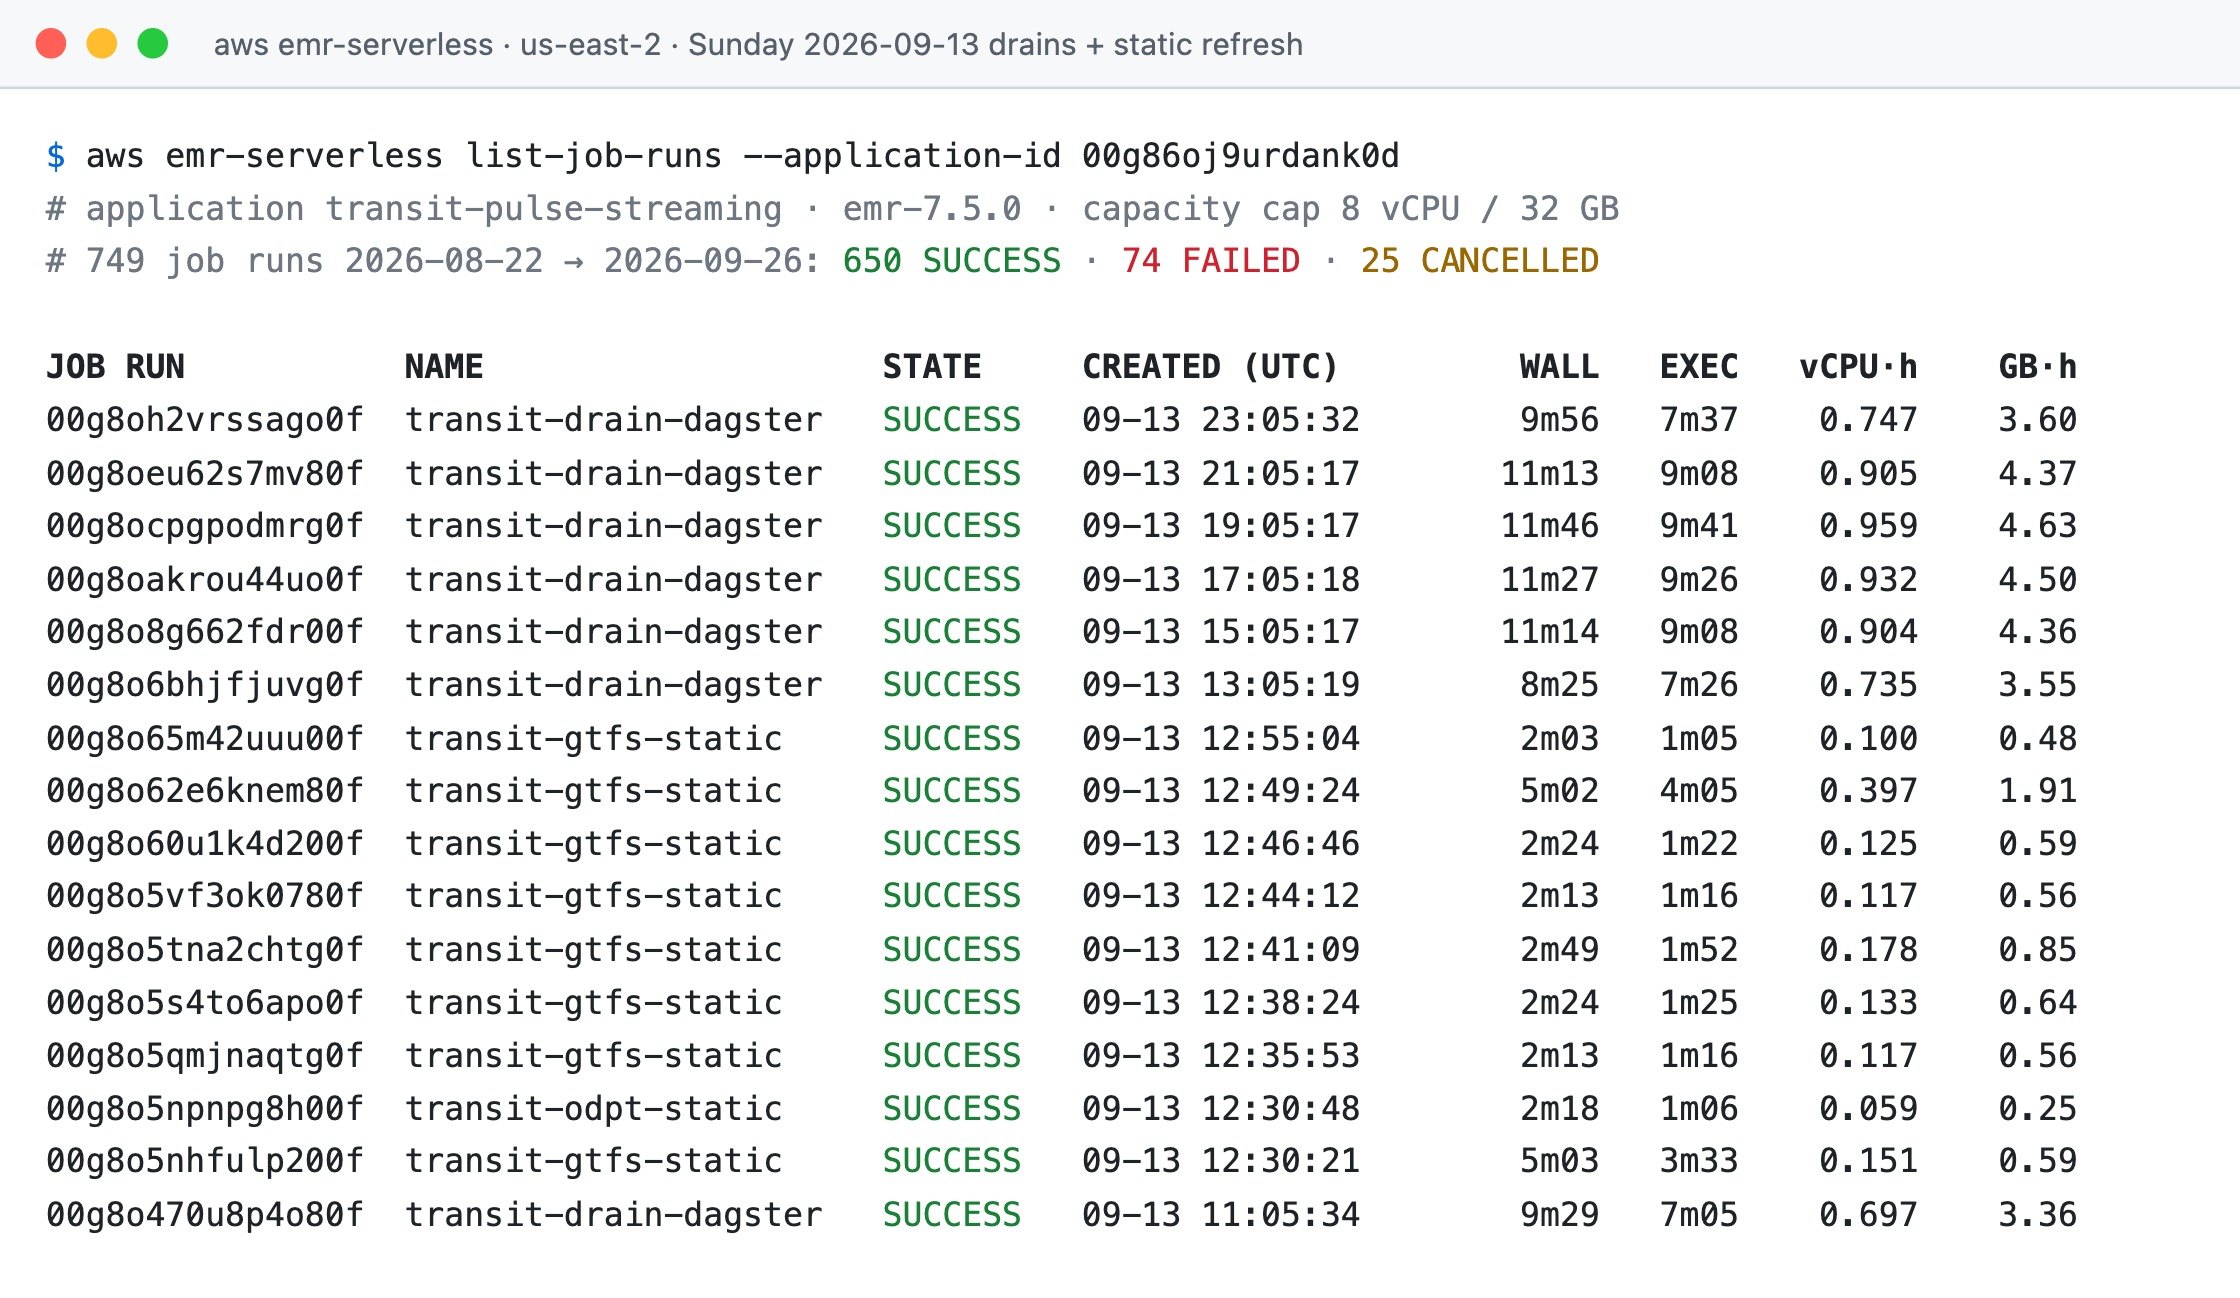
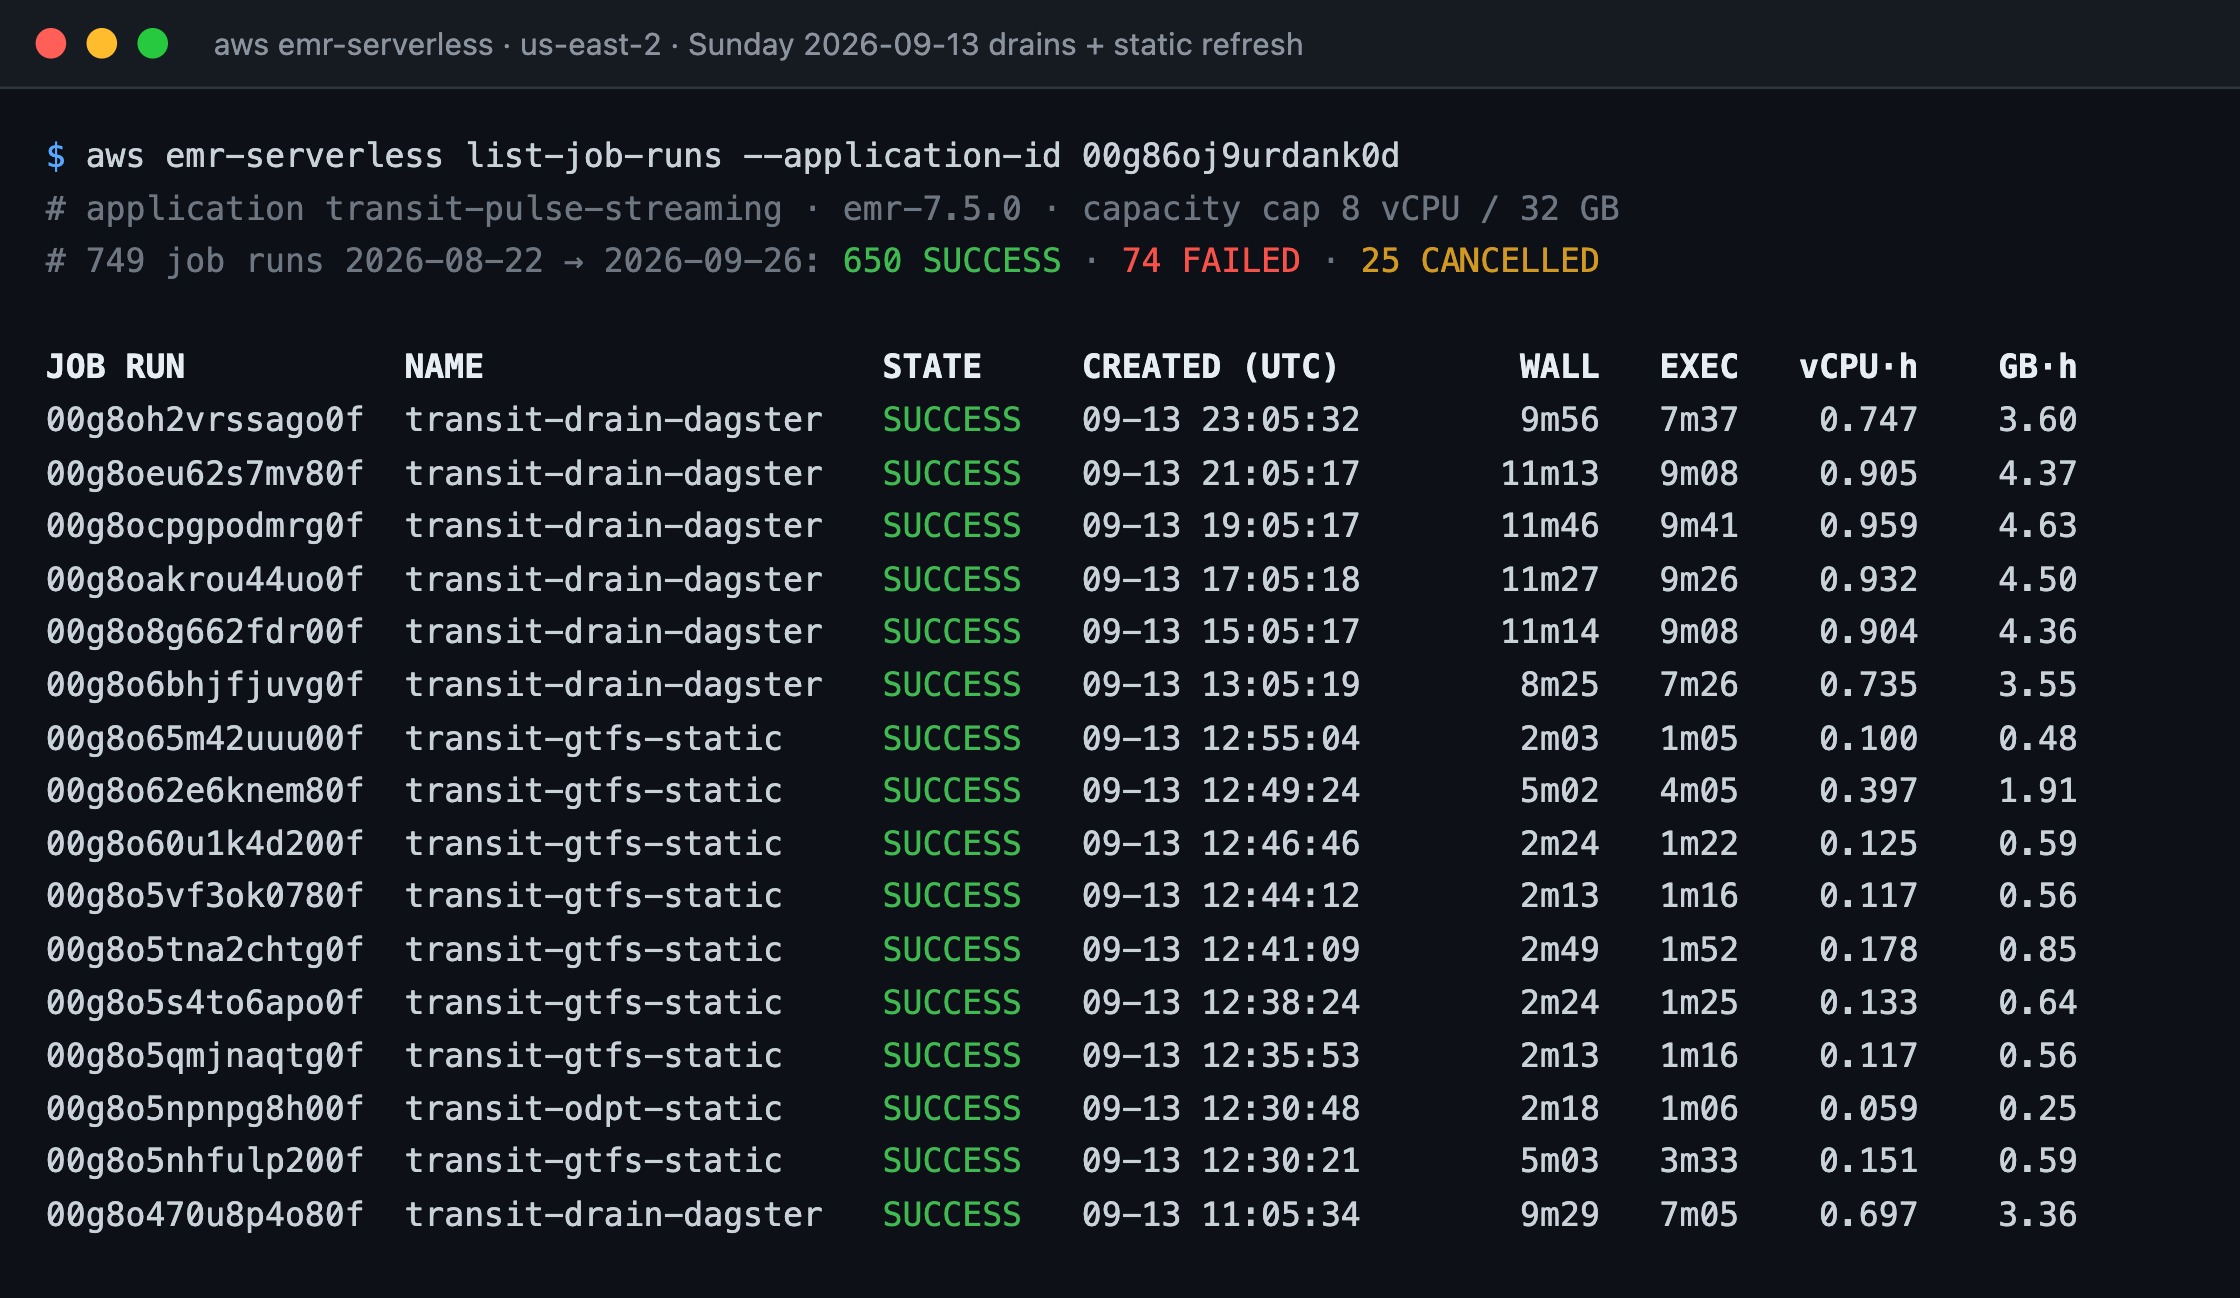
749 job runs on a serverless Spark application.
- emr-7.5.0 capped at 8 vCPU and 32 GB: 650 SUCCESS, 74 FAILED, and 25 CANCELLED between August 22 and September 26.
- A representative Sunday shows the two-hourly drains at 7m to 9m41 of execution, 0.70 to 0.96 vCPU-hours each, beside the weekly static GTFS refresh at one to four minutes.
- Nothing runs between drains. Processing is needed every two hours, so the compute exists for about eight minutes and then stops.
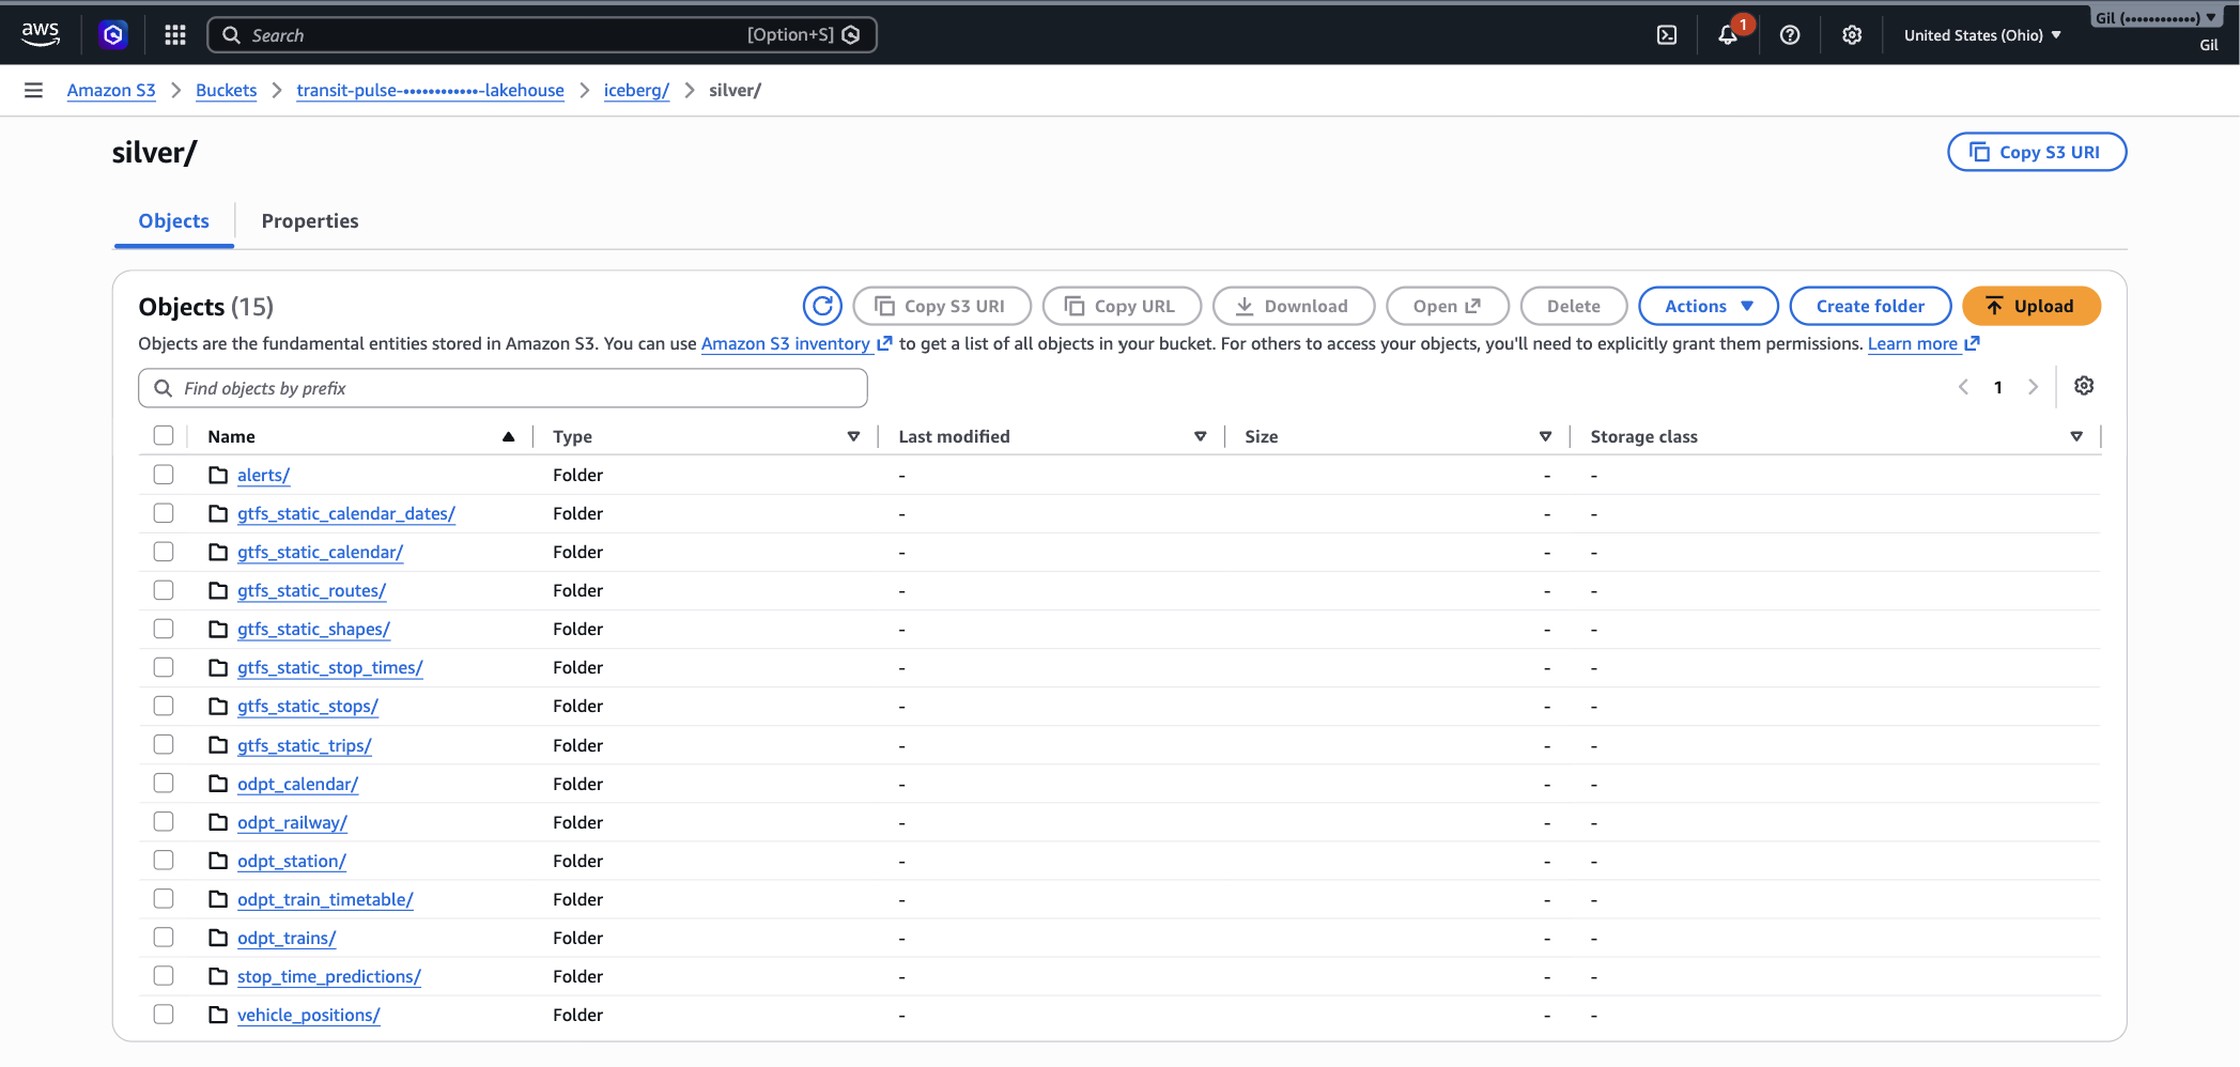
The lakehouse on S3.
- iceberg/silver/ holds 15 Iceberg table folders: stop-time predictions, vehicle positions, alerts, odpt_trains, seven gtfs_static_* tables, and four odpt_* tables.
- Bronze runs 139.2 GB across 119,770 objects and silver 48.8 GB across 71,308.
- The raw archive peaked at 162 GB and 531,745 objects under a seven-day expiry: every response kept long enough to rebuild from, and no longer.
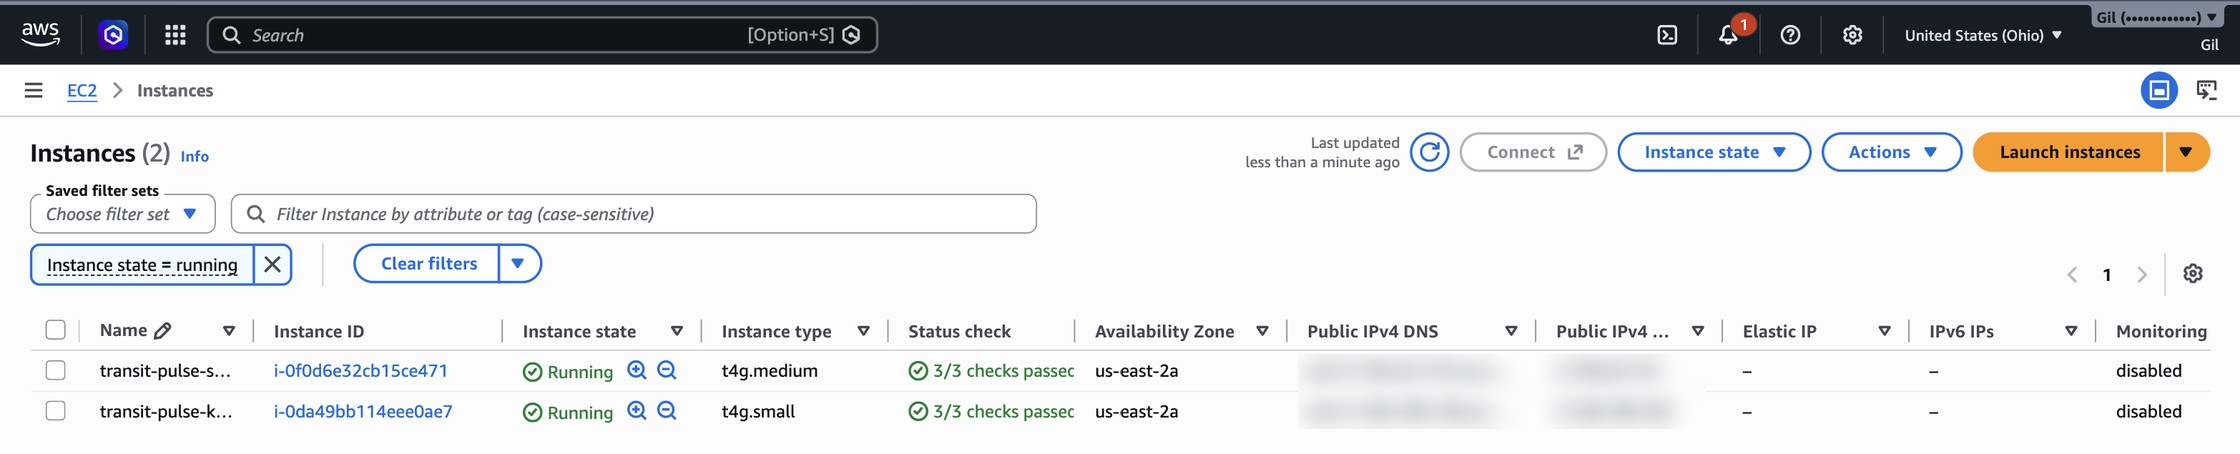
Two instances carry the whole system.
- A t4g.medium runs Dagster, Postgres, and all eight pollers; a t4g.small runs the Kafka broker on 48 GB of gp3.
- Both sit in us-east-2a and both report 3/3 status checks.
- Kafka is isolated on its own instance so a poller restart or a Dagster deploy cannot take the buffer down with it.
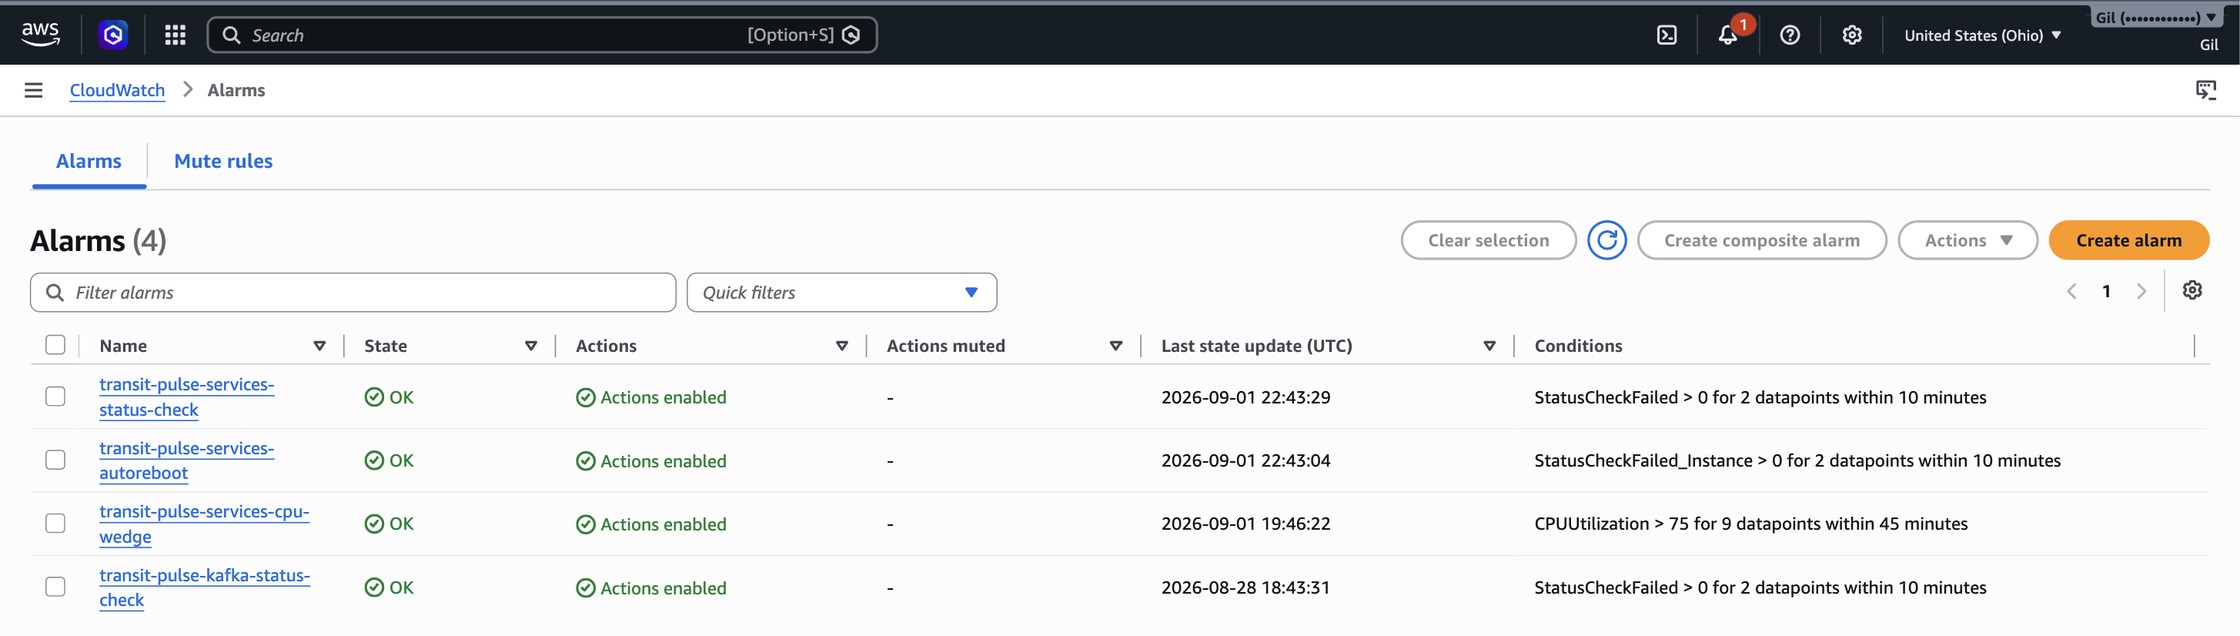
Four alarms, all green.
- Status-check alarms cover both instances, alongside a CPU-wedge alarm that fires above 75% for 9 of 45 minutes.
- The autoreboot alarm acts instead of notifying: StatusCheckFailed_Instance triggers a reboot.
- SNS carries both failure and recovery mail, so a silent recovery still gets reported.
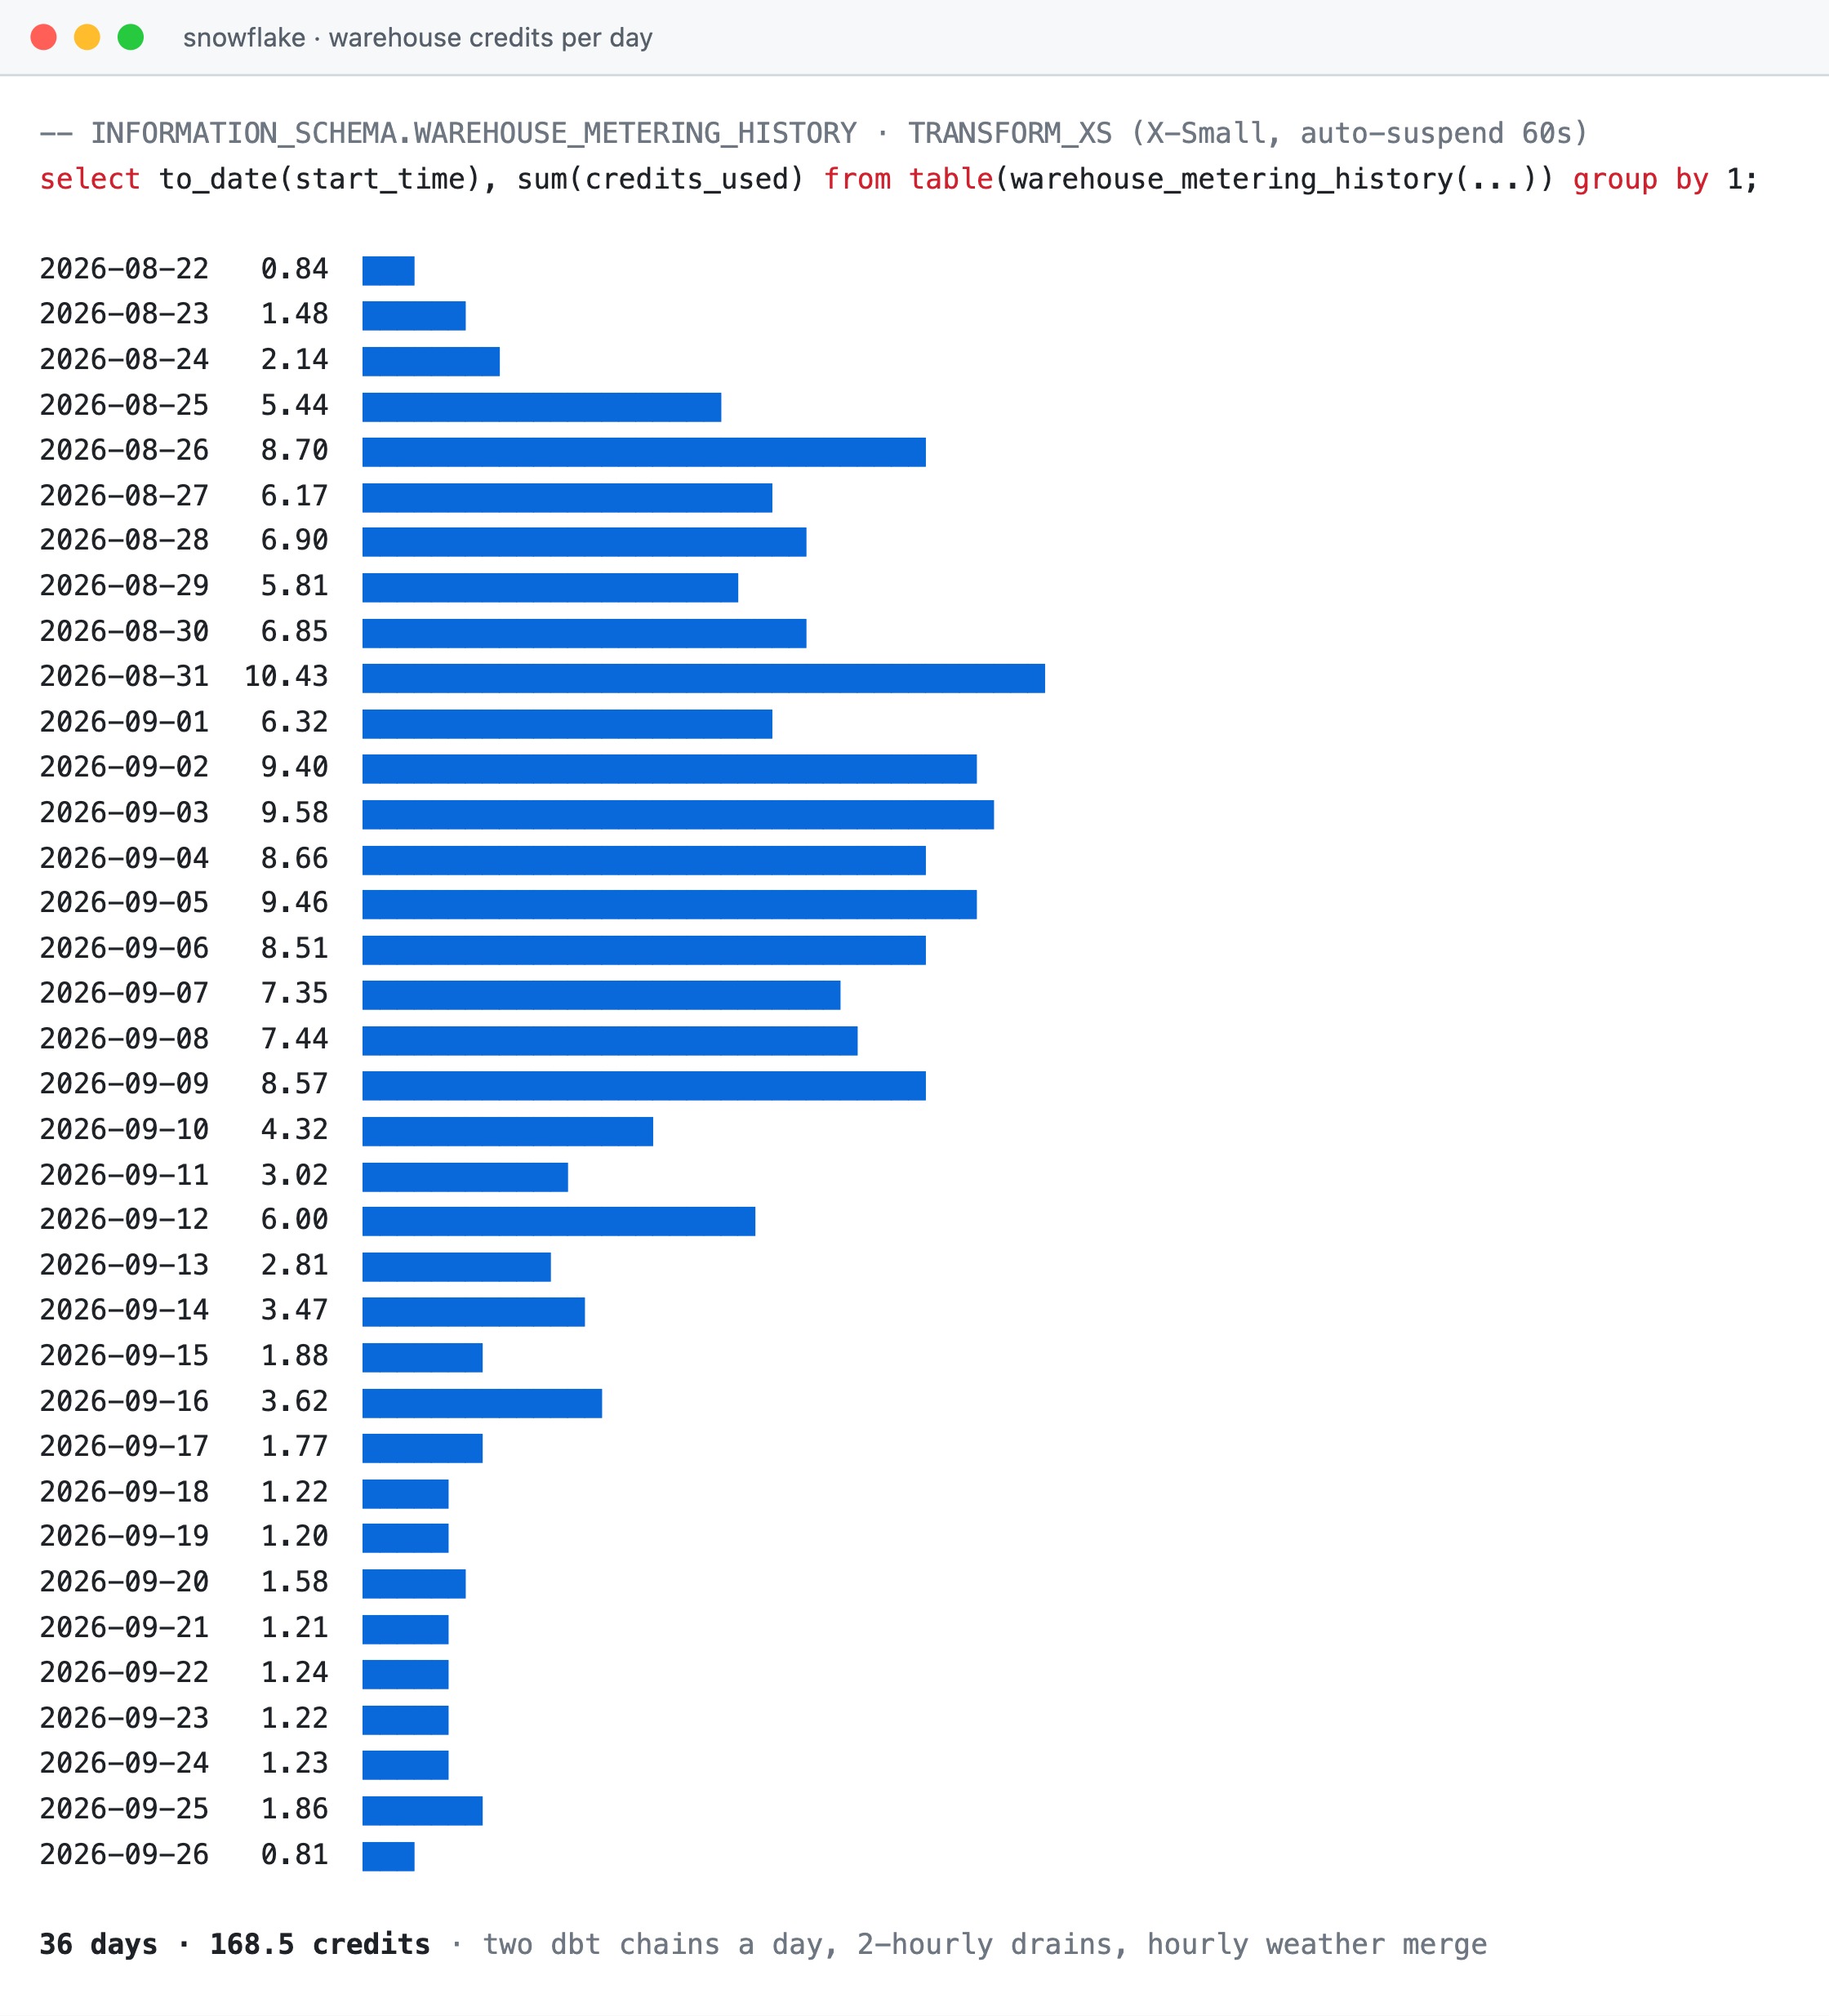
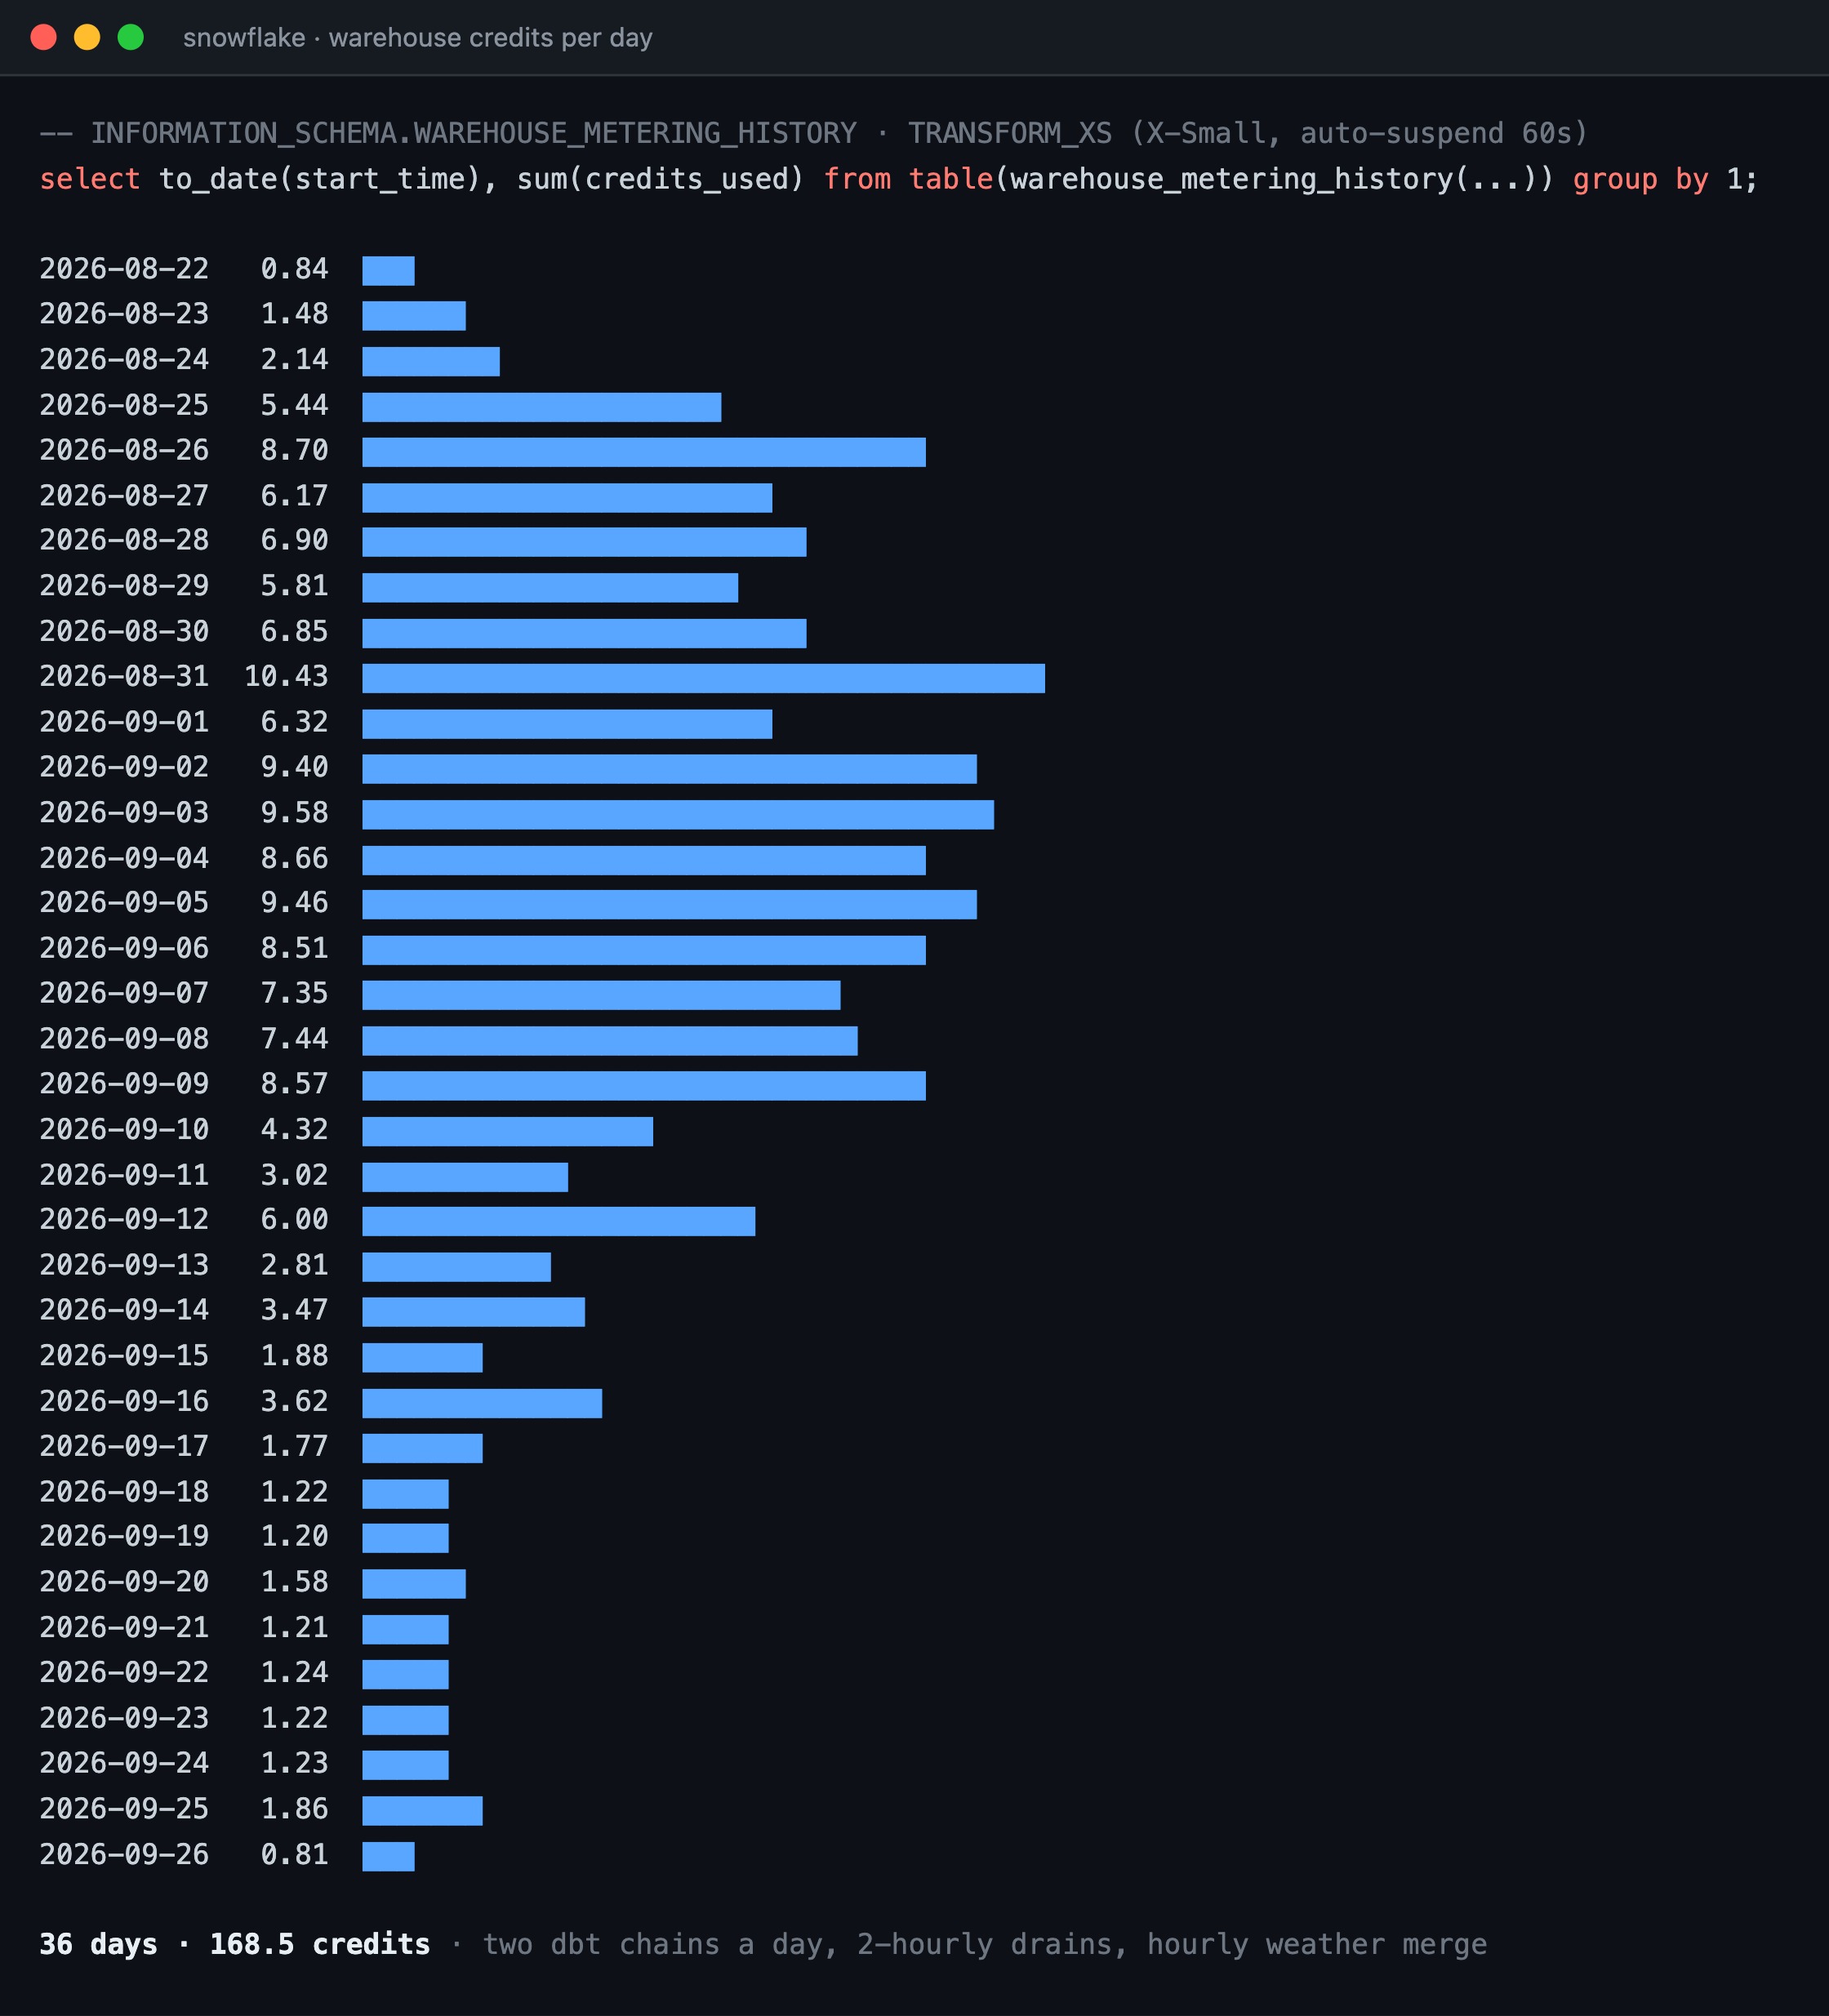
168.5 credits over 36 days on an X-Small warehouse.
- TRANSFORM_XS runs the entire modeling layer — 50 models and 242 tests, twice a day — for 168.5 credits between August 22 and September 26.
- Daily draw peaks near 6 credits during backfills and settles around 1.2 once the pollers retired.
- The warehouse auto-suspends after 60 seconds, so the credits track query time rather than uptime.
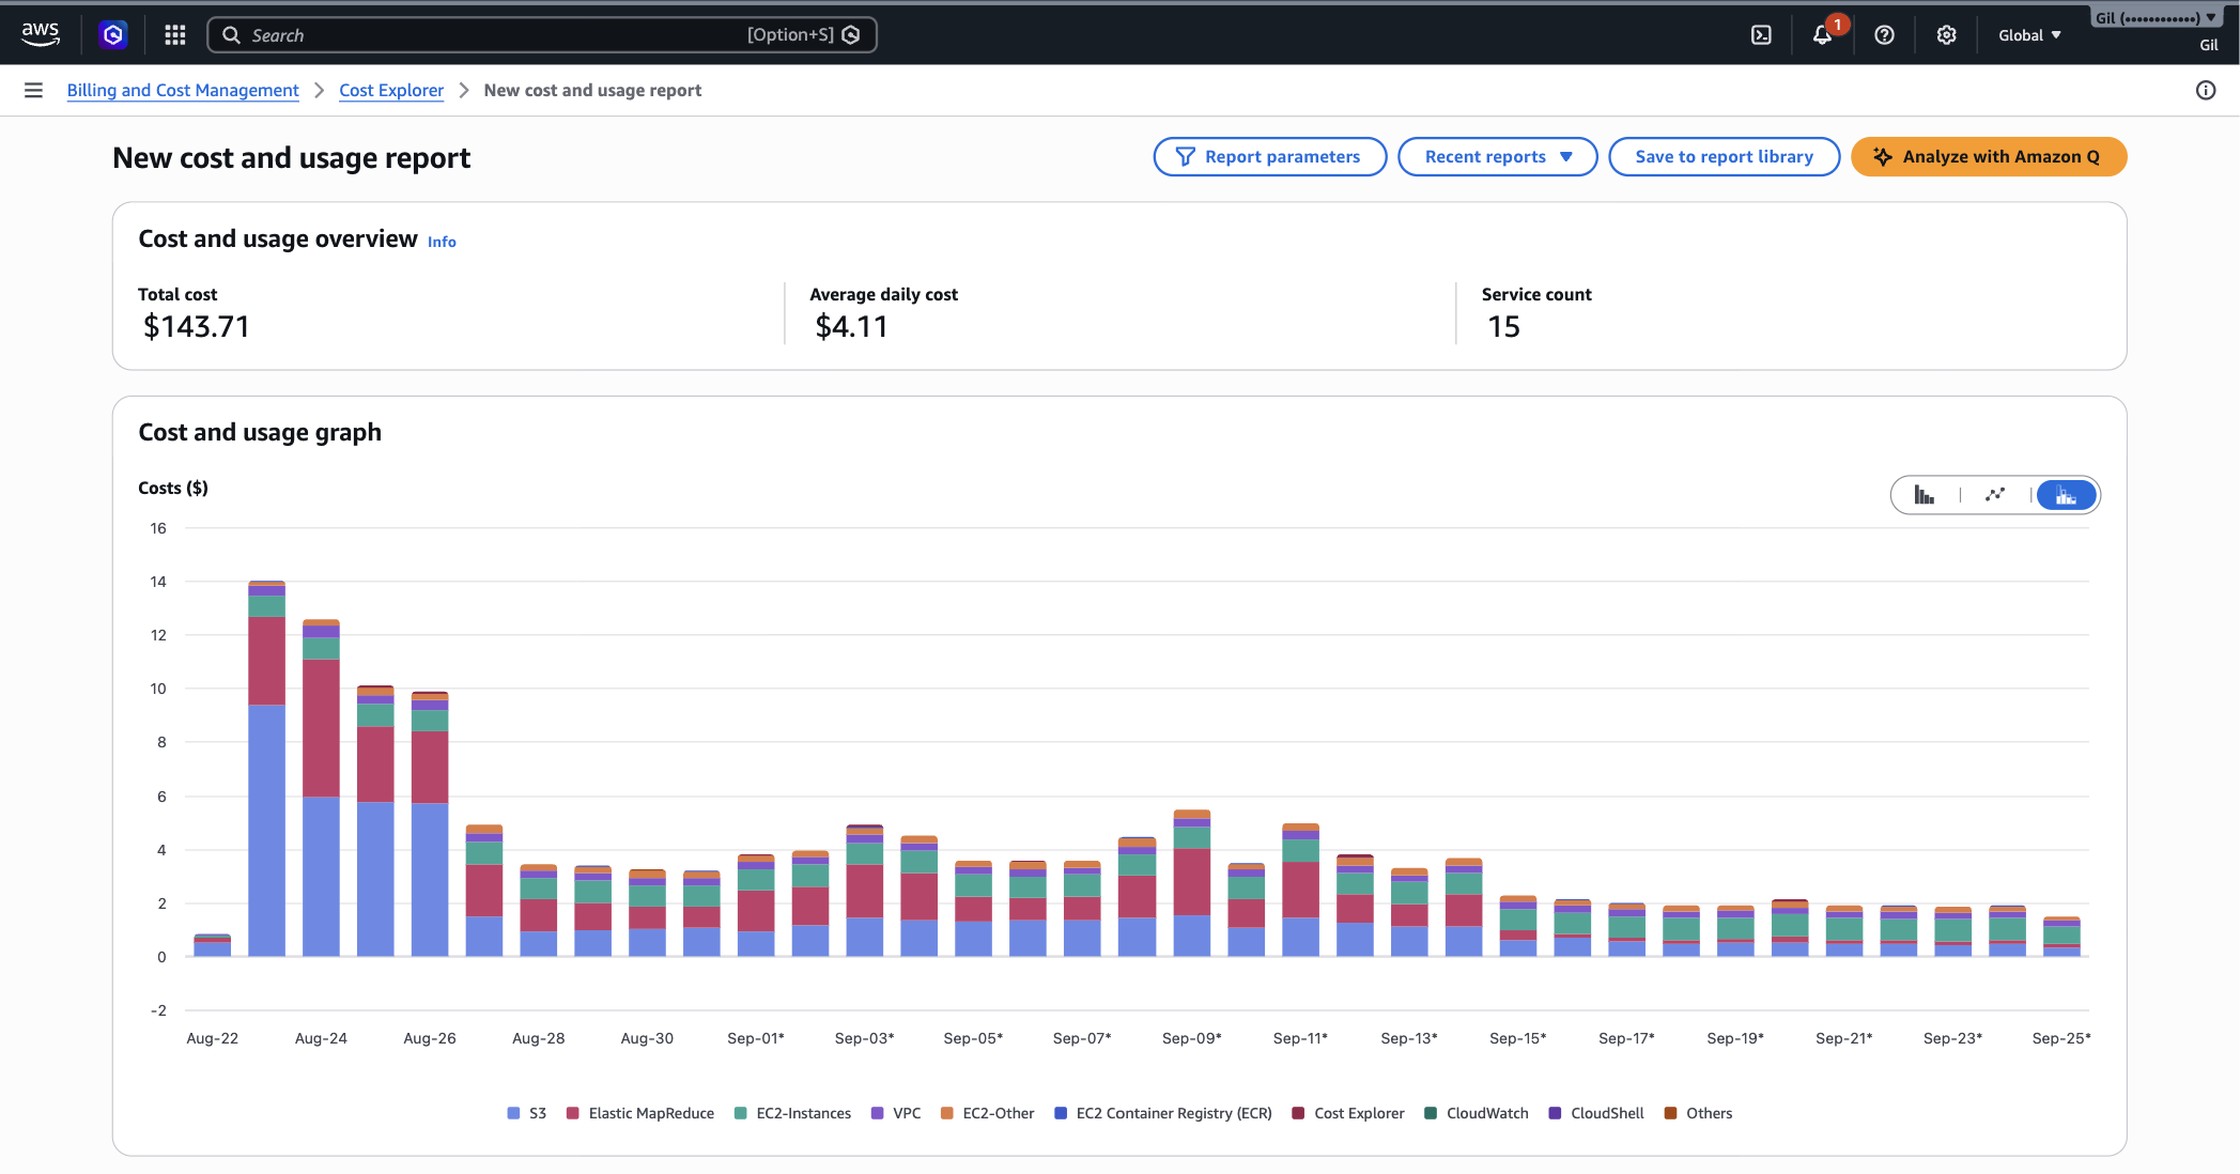
A month of eight-city ingestion for $143.71.
- Daily usage charges across 15 services from August 22 to September 25, averaging $4.11 a day, with S3, EMR, and EC2 the three largest.
- The shape tracks the work: about $14 a day through the opening backfill, about $2 a day once the pollers retired.
- Credits covered the run; September net billed came to $0.16.