Overview
An end-to-end churn pipeline over 7,043 telecom customer records (the IBM Telco dataset), running from exploratory analysis to a deployed prediction service: EDA, K-Means segmentation, Kaplan-Meier and Cox survival modeling, a 14-classifier benchmark with Optuna tuning, an A/B testing framework, an impact planner, and a FastAPI service shipped in Docker with a 143-test suite.
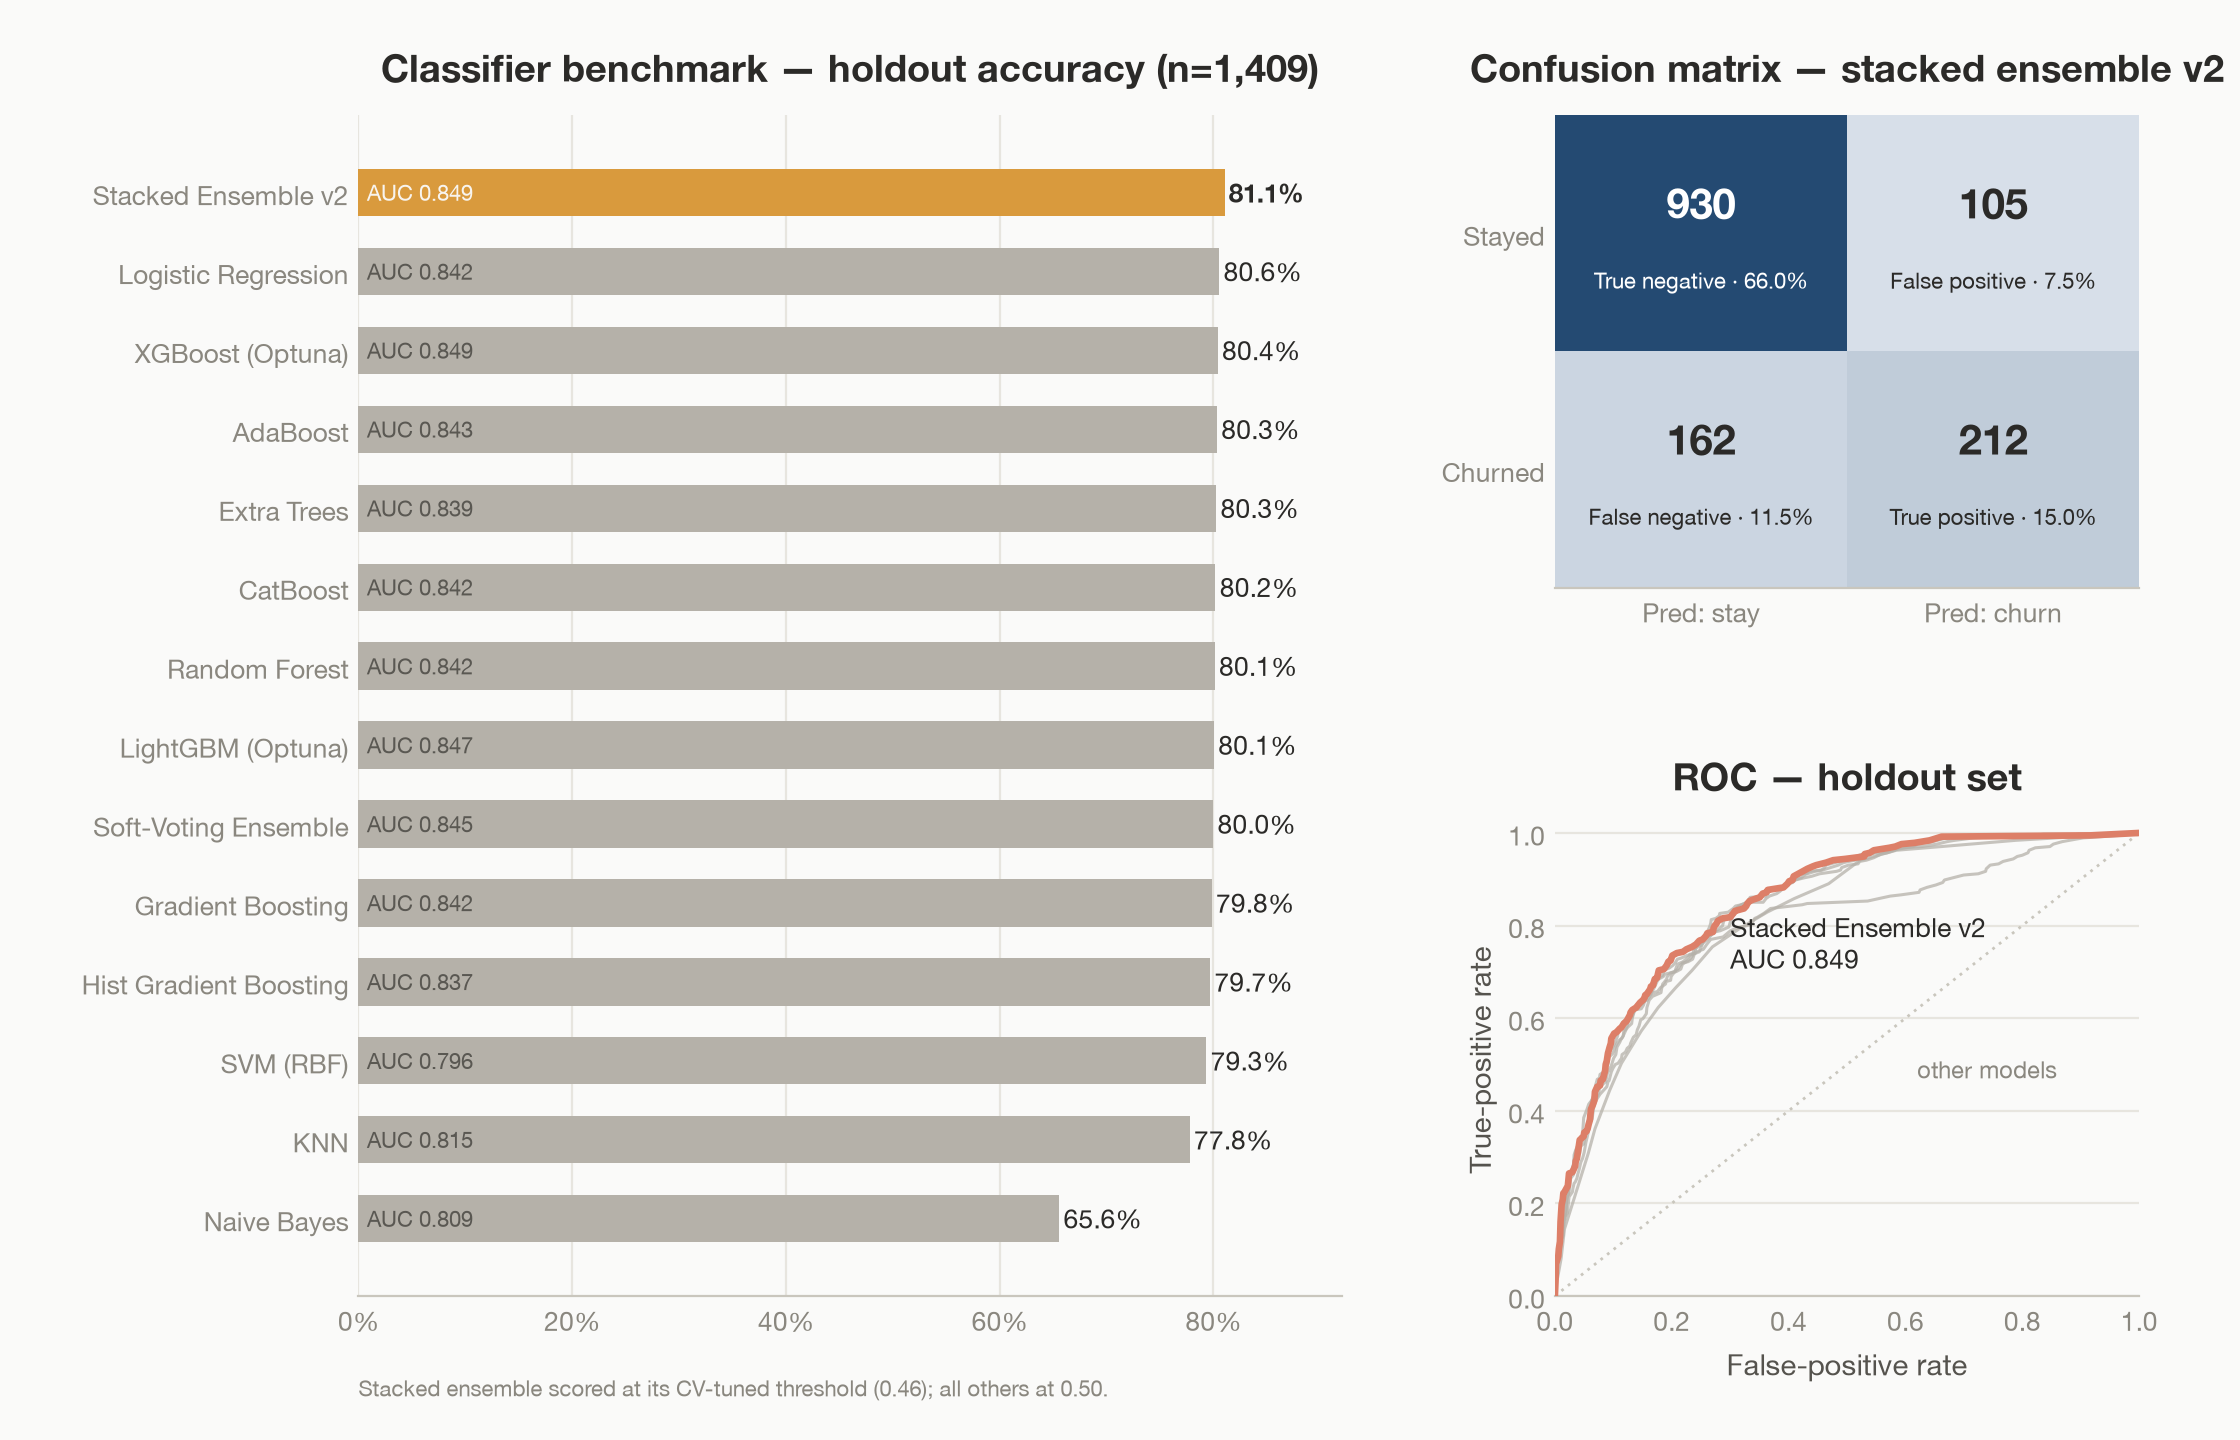
The final model is a stacked ensemble — Optuna-tuned LightGBM, XGBoost, Gradient Boosting, Random Forest, and Logistic Regression under a logistic meta-model — scoring 0.849 ROC AUC and 81.1% holdout accuracy. The number that matters is lift: the top-scored 10% of customers is 75% actual churners against a 26.5% base rate (2.8× lift), and the top 30% captures 66.8% of all churners. Every model family plateaus near 81% accuracy on this dataset — the majority-class baseline is already 73.5% — so ranking power is the honest headline.
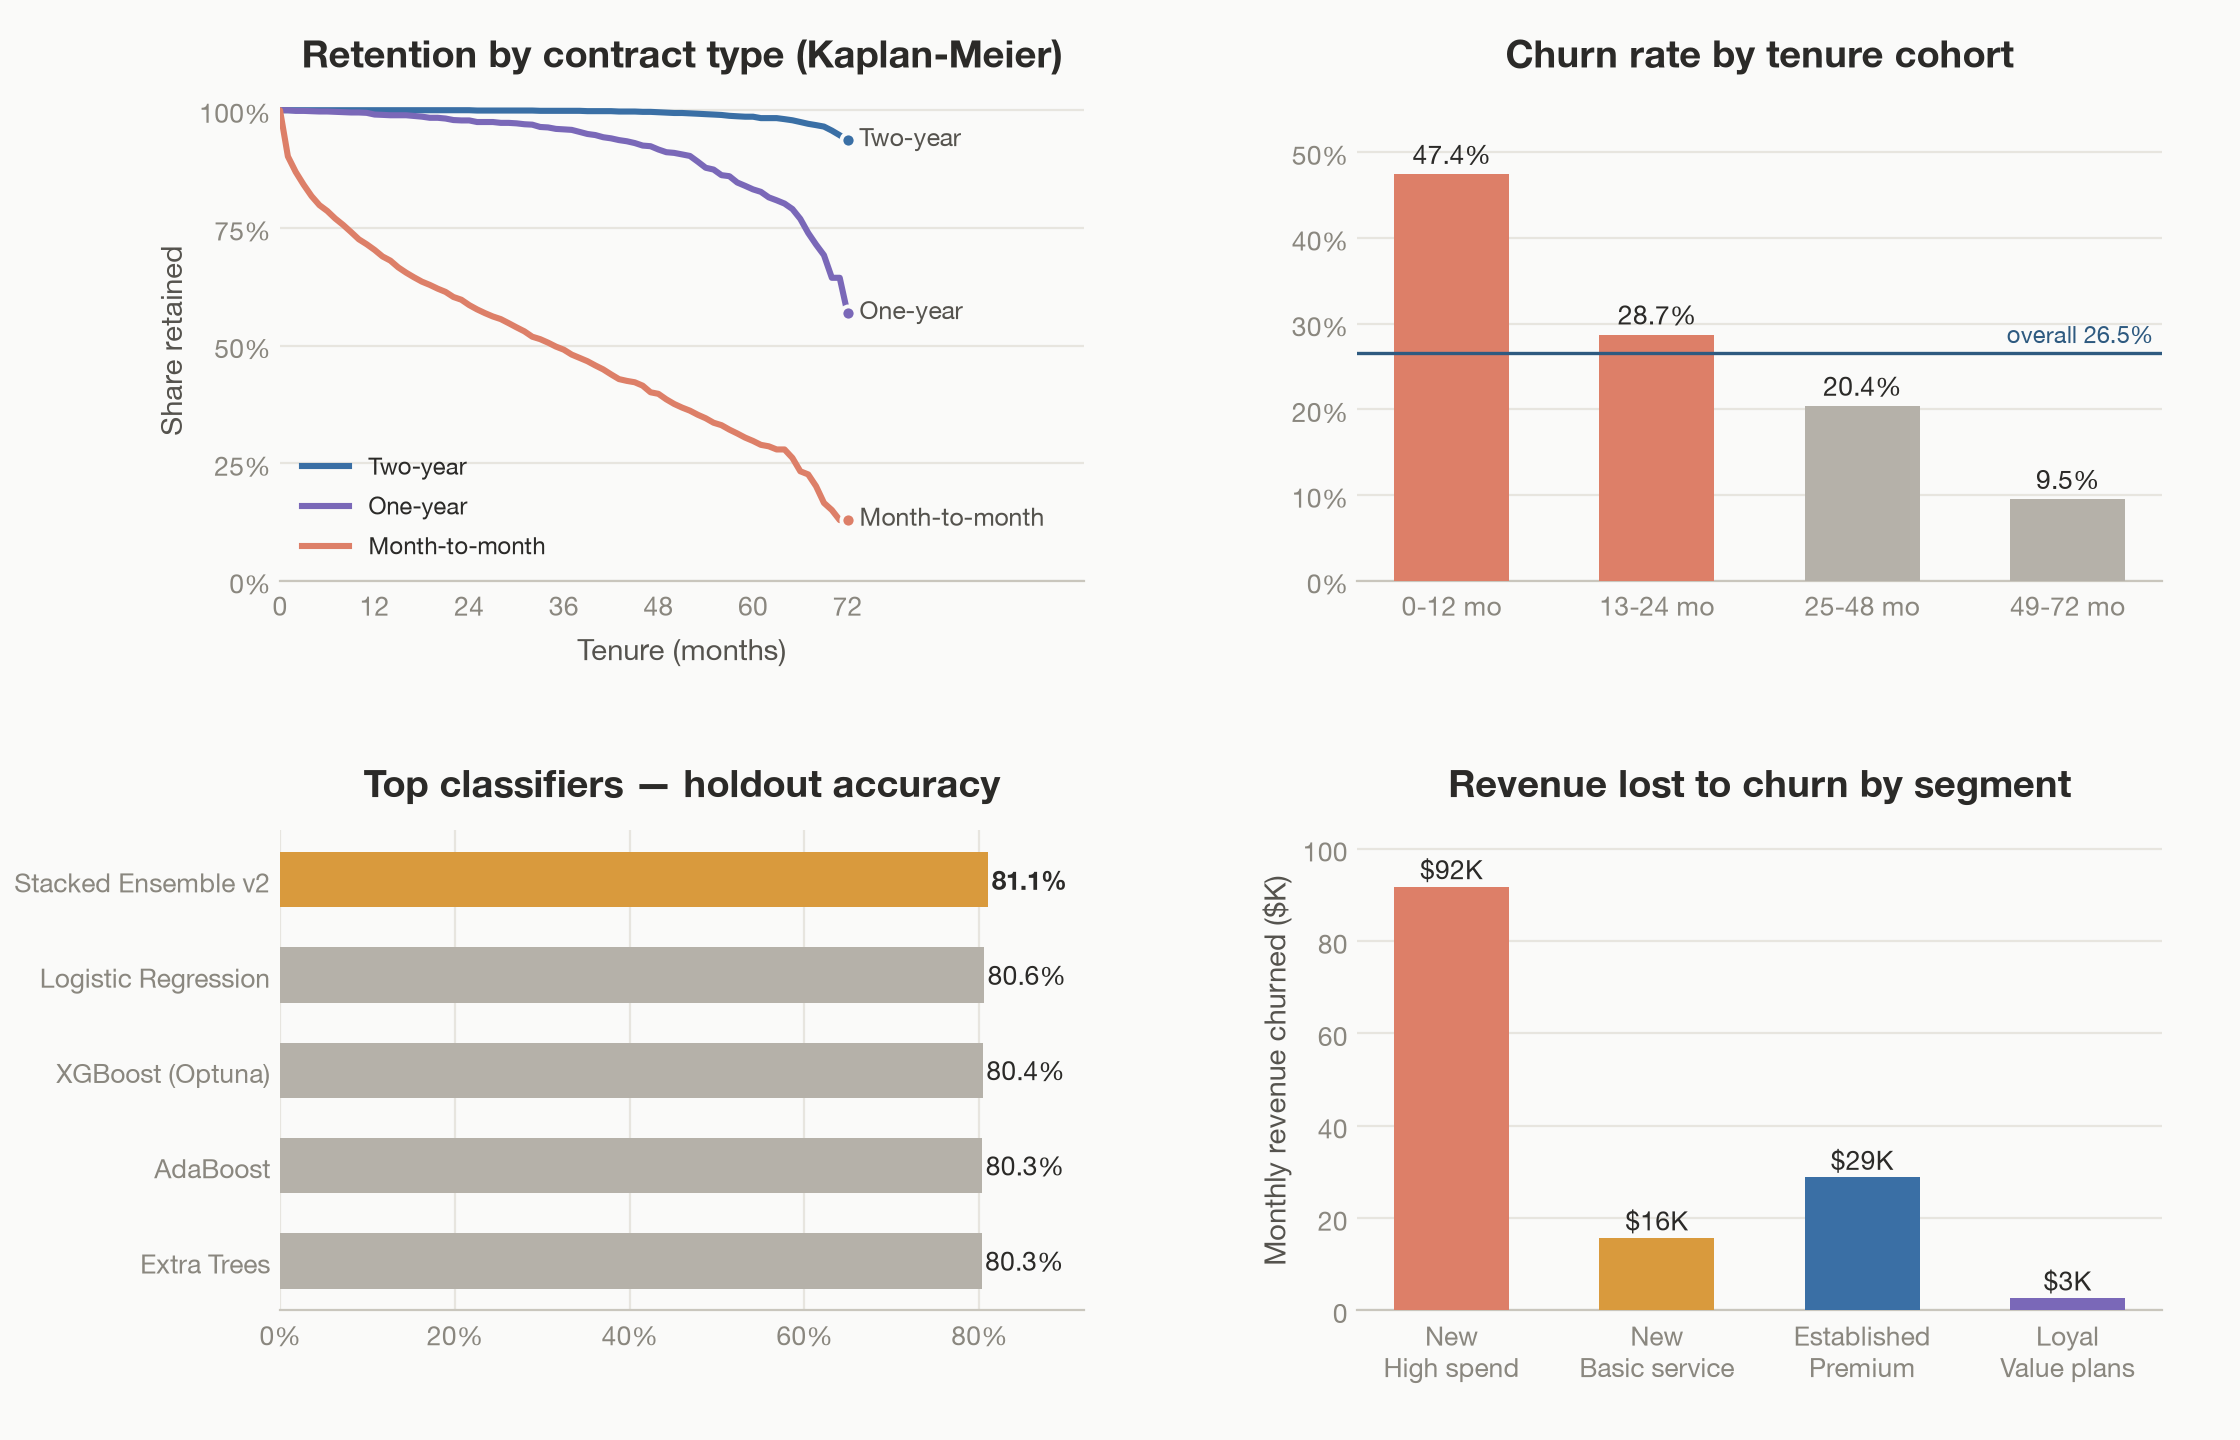
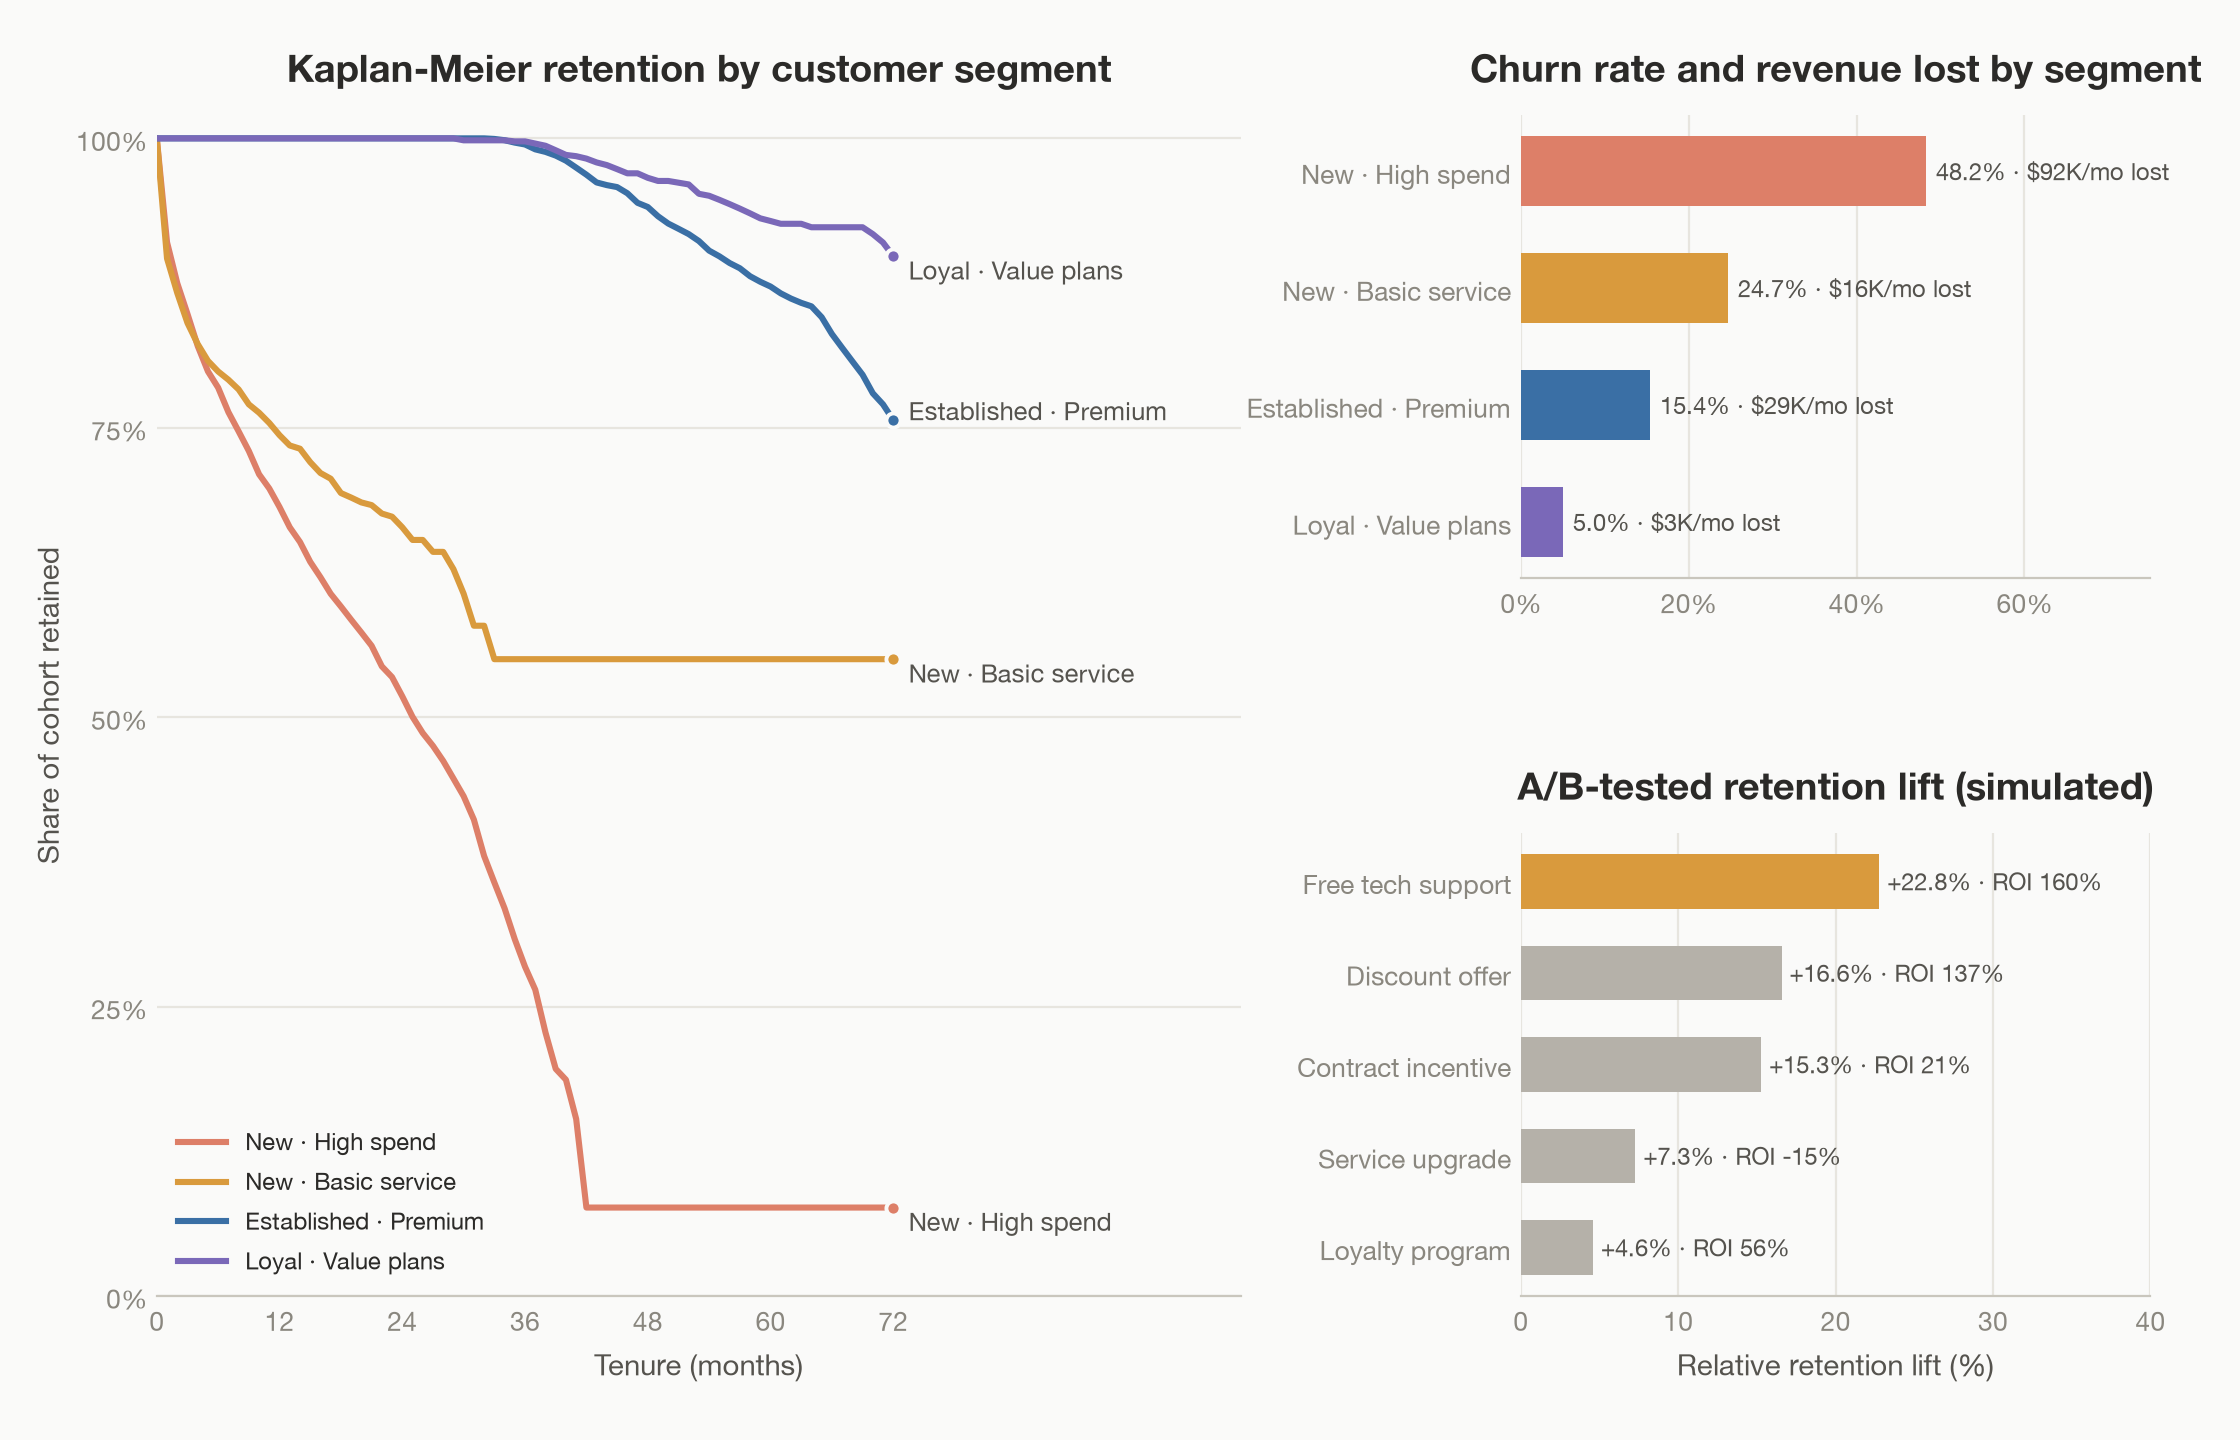
The analysis behind the model tells the retention story: $139K of $456K in monthly recurring charges is lost to churn. Month-to-month contracts churn at 42.7% versus 2.8% on two-year terms — a 15× gap — and the first-year cohort churns at 47.4%. One segment, "New · High spend" (2,276 customers), carries 48.2% churn and 66% of all churned revenue: that's the retention target.
The Problem
Churn is expensive and mostly invisible until it happens — and on this dataset a raw accuracy number actively misleads, since predicting "nobody churns" already scores 73.5%. A retention team needs to know who is at risk, how soon, which levers matter, and what an intervention would actually return.
So the pipeline pairs prediction with survival analysis, segmentation, and an impact planner, and the output is a ranked, costed retention playbook rather than a classifier score.
Key Features
- EDA and K-Means segmentation over 7,043 records (26.5% churn rate)
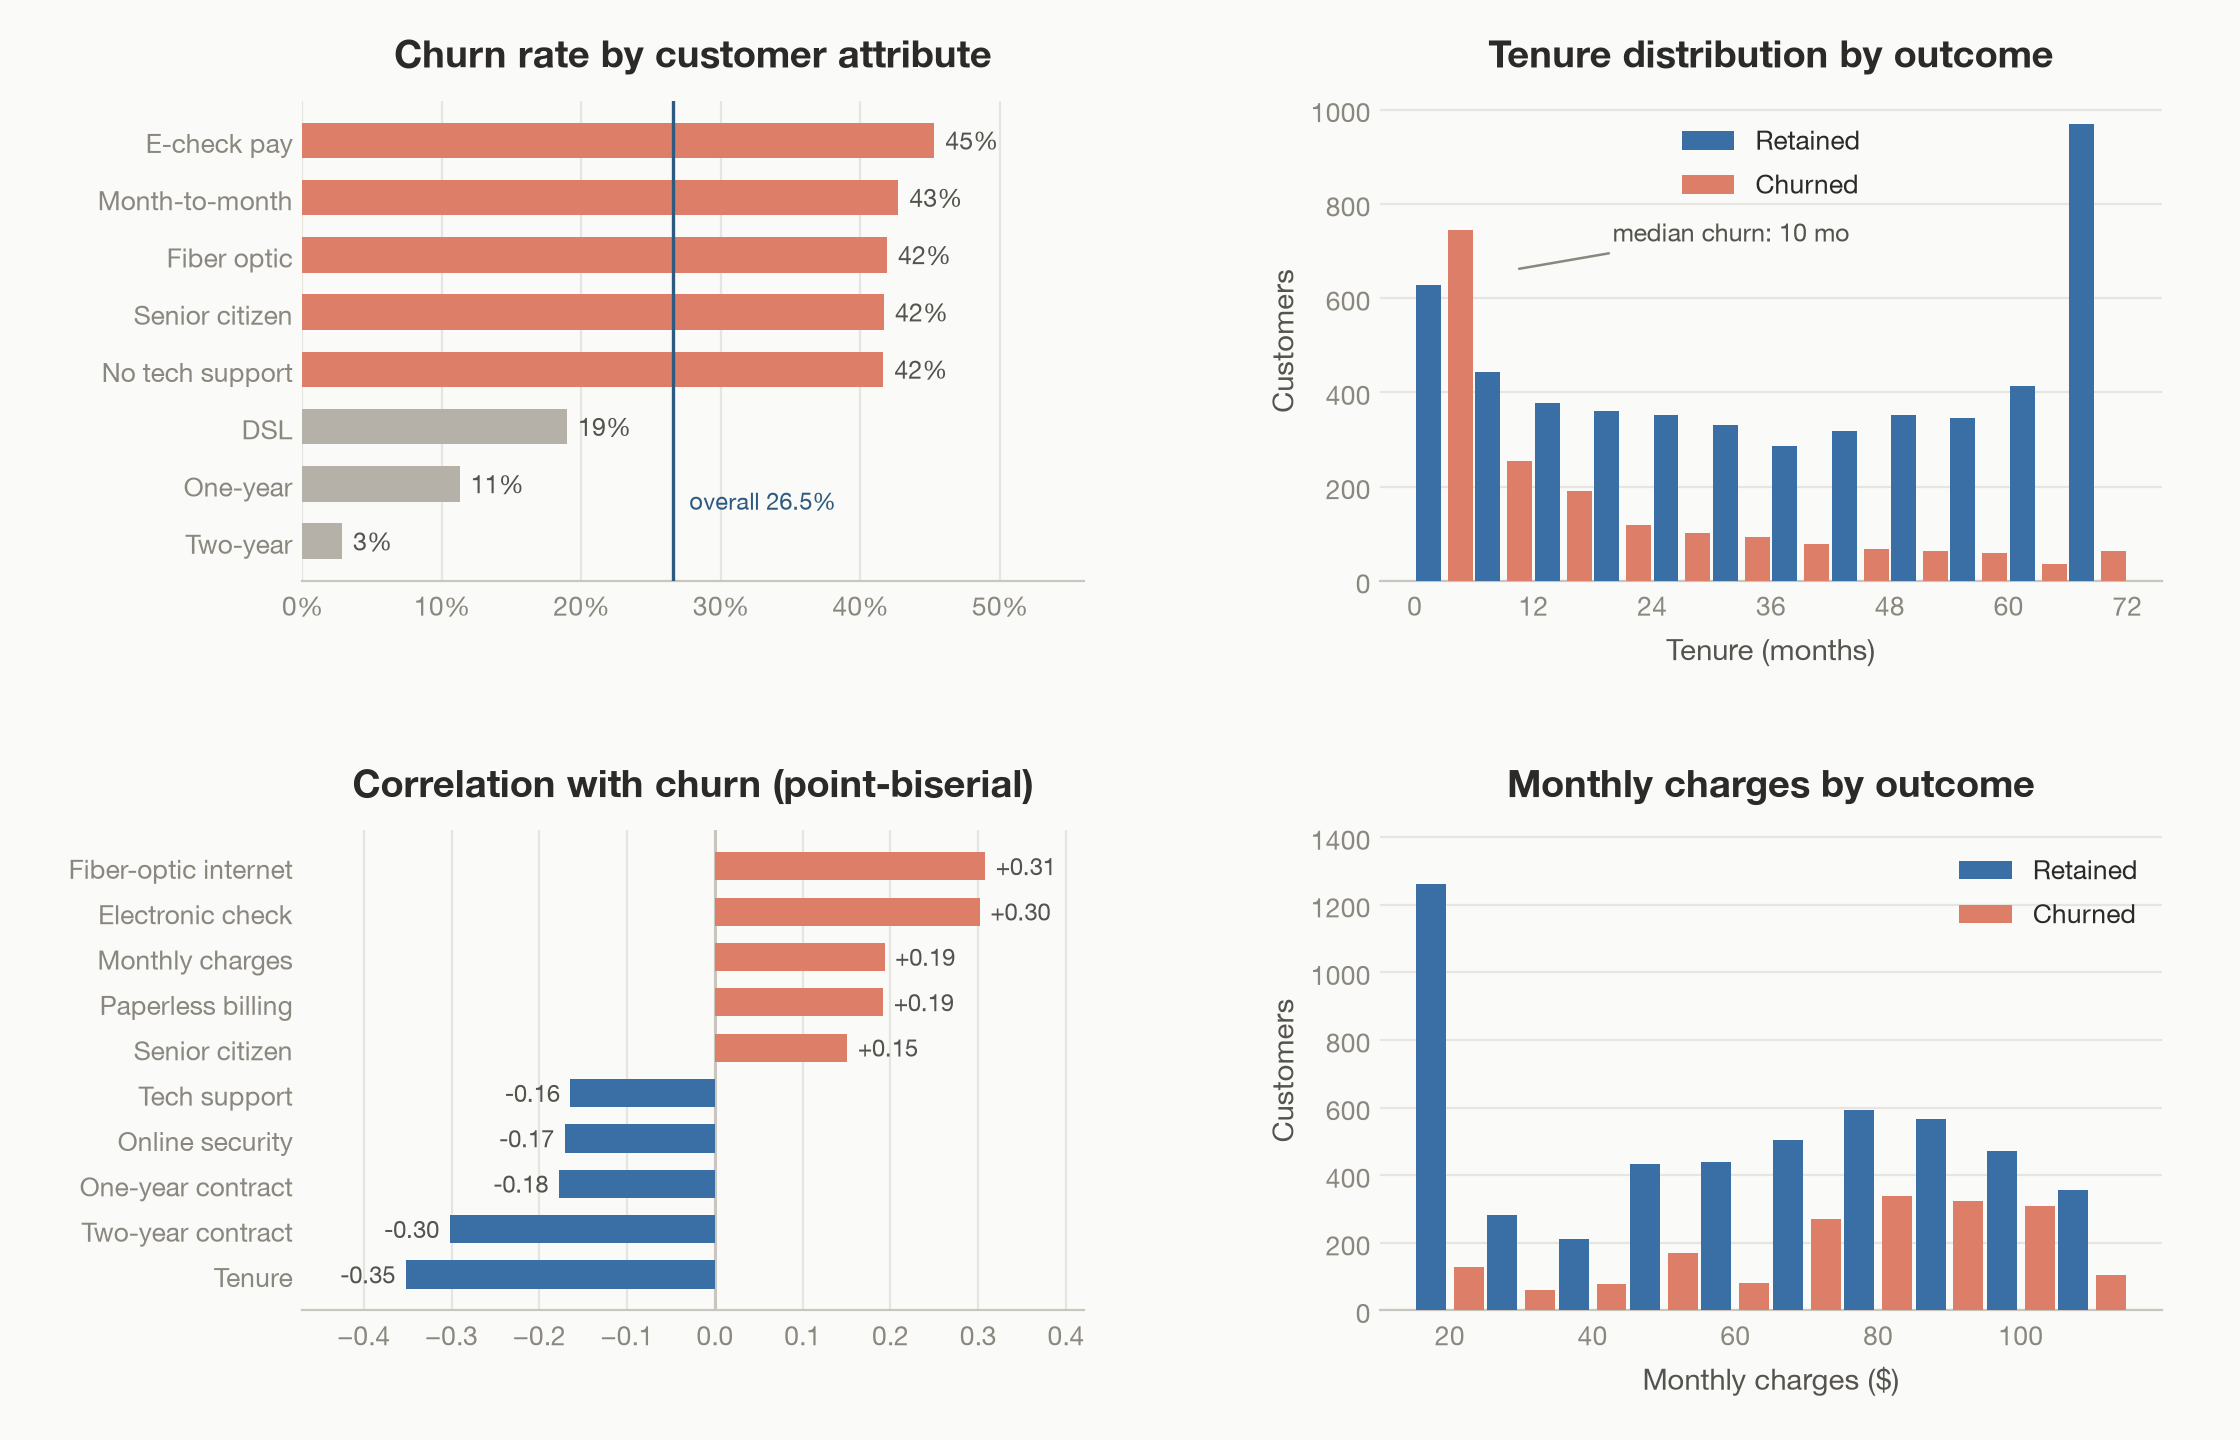
- Kaplan-Meier and Cox survival modeling — hazard ratios: fiber-optic internet 2.27, electronic check 1.78, two-year contract 0.08
- 14-classifier benchmark with Optuna tuning; stacked ensemble at 0.849 ROC AUC and 2.8× top-decile lift
- A/B testing framework (seeded simulations) and an impact planner projecting ~595 customers retained per year and $423K net over 12 months (253% ROI)
- FastAPI prediction service, Docker deployment, 143-test suite
Stack
- Python
- pandas
- scikit-learn
- LightGBM
- XGBoost
- Optuna
- FastAPI
- Docker
Architecture
The analysis is a staged pipeline: raw records flow through cleaning and feature engineering into segmentation, survival modeling, and classifier training, with each stage reproducible and inspectable on its own.
Model selection runs as a 14-classifier benchmark on a shared harness — Optuna tunes the strongest families, and the final stacked ensemble combines them under a logistic meta-model with a CV-tuned decision threshold, evaluated on an 80/20 stratified holdout.
Serving is production-shaped: a FastAPI prediction service packaged in Docker, backed by a 143-test suite spanning the pipeline and the API.
The framework is explicit about what's real: A/B test lifts are seeded simulations demonstrating the framework, the churn trend analysis runs on a synthetic time index (the dataset has no calendar dimension), and impact figures are projections combining real cohort revenue with those simulated lifts.
Skills Applied
- Data Analysis
- Exploratory analysis, cleaning, and feature engineering over 7,043 records, with K-Means segmentation isolating the high-value retention target.
- Machine Learning
- 14-model benchmark with Optuna tuning and a stacked ensemble — 0.849 ROC AUC, 81.1% holdout accuracy, 2.8× top-decile lift.
- Survival Analysis & Statistics
- Kaplan-Meier curves and Cox proportional hazards quantifying when and why customers churn, plus an A/B testing framework built on seeded simulations.
- Deployment & Testing
- FastAPI prediction service with Docker deployment and a 143-test suite across pipeline and API.
- Business Translation
- An impact planner turning model output into costed retention programs — projected $49K/month revenue protected at 253% ROI, led by free tech support for fiber users ($216K projected net).
Live Demo
A hosted demo is in the works — it will live right here on this page.